|
2100
|
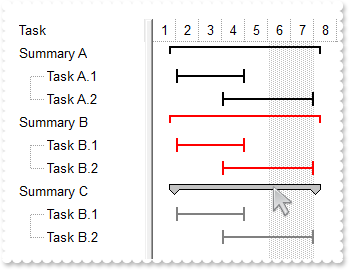
Can bars have a grey backcolor and black border color for a summary-bar (EBN)
with thisform.G2antt1
	.BeginUpdate
	with .VisualAppearance
		.RenderType = -2
		var_s = "gBFLBCJwBAEHhEJAAEhABN0GACAADACAxRDAMgBQKAAzQFAYahuGSGAAGMYxQgmFgAQhFcZQSKUOQTDKMIziYBYJhEMQyDAAUIjOKsIhkGYcZAGQBJCjWGodQLOEgwHI"
		var_s = var_s + "ERQjEyUJAGGQIHhyPYbUbGUpQHKkeRtGqgBgoKhKEouNYgAbGYIwTRsdyfDSXBpEWwbDgkNQwWTDNoRDIUQStCysaYjOpnfrUAJ1P7FdQ1NJkXRhGSSK7maapaiCSZ6S"
		var_s = var_s + "TCMj1FhVKSNJ7DQKhGpgKh/ApgYpQOK4fLNXyRBK4QAyKA6bgPFZOZbFViaXY1V5bNKrcjhHQwAyHJ4XXRdV4YRAkUT4GqiJKGSYcQhuXZWbRqO6ABhef6DRThc6jKpF"
		var_s = var_s + "HIE4llEcojHqSZNgoIxnlgd5thsLREleL43gsYZ9BkaAYkMAgAm+CxGDWWAtiKCRfjcdRgHoHYnicUwgAIEIREAaQYkcQZUHIGRUDQJBOEYRAhDYCxGgMZAkCgdYQhaX"
		var_s = var_s + "QIAYERwQuahXggdgeG6VZ4H4IhdiIGIOB8YIiGiHZZgqYpGF4KYHiKCI+CAU5jCiTQ2g0YhEFyax4gABAEIC"
		.Add(1,var_s)
		var_s1 = "gBFLBCJwBAEHhEJAAEhABU0IQAAYAQGKQYhiAKBQAGaAoDDcMA4QwAAyjAKMEwsACEIrjKCRShyCYZRhGcTAJBMIhiGQYAChEZxVhEMgzDjIAxSJAcQRFESaAABGCQGh"
		var_s1 = var_s1 + "+N4/S4NIi0CIsZQjCaiZ7pKA5bgMCo+UrNMixZQVCSOGChYRpCaZWpGGodQRUFbVHAlKypJKCKrEWSrDhuYAAW7XM7yBS1TzVNSuLZtaLqSroAJ1WTWMB0Ra8NzZEKfa"
		var_s1 = var_s1 + "ZACj4arKejrRDCMAggI="
		.Add(2,var_s1)
		var_s2 = "gBFLBCJwBAEHhEJAAEhABN8GACAADACAxRDgMQBQKAAzQFAcDBvBgABiHEZoJhUAIIRZGMIjFDcEwxDSMY7jcYAFgkNQwCUtcBIJDEMIoAJLIwyBKkNQ5AabYrmWJpMg"
		var_s2 = var_s2 + "OEAyDSJM70DCEThLD4aZJnOa5ZjmH5LRBQdBRXQMYwIGCiZQpeKqbgMBoJApCIJxdBNLAAf60LLtGJaSpKZouViJNjSBD4HQTL6BQwsKxIDqaaD/WpgFuLTjiRImShcM"
		var_s2 = var_s2 + "QXJYFbwTOyBbDjG7rJr+FptYRbdYYRQ8dy7Cywa6pOa8YwacotZrAdDXHTmHw1PTRNDmTRYRwfKqJZxieqwHoMLYgAC8Ni3OaoDAiCRQGiYZyHKaRSwPBInIYIIjeRgz"
		var_s2 = var_s2 + "BSAYKCEOySEodZbjybo0HefwfhMLQDnKeg9D6LwsCeV5unYQJYH8Lxvj+a5jgSfIYH8T43hOcZ5H+X4nh2fB6F+aABnOAIfFgFgGgGH43nICoCl+eA1n0fBhAgVZ5gSH"
		var_s2 = var_s2 + "oID4FoDCCCBqBuBYUjgfgigGURYg4JoJmKCBFBaChikiNgVEYYpokYMoMCMKJWCkcIjgiZg6E0Do3gUASAg="
		.Add(3,var_s2)
	endwith
	.Columns.Add("Task")
	with .Chart
		.PaneWidth(0) = 128
		.FirstVisibleDate = {^2001-1-1}
		with .Bars.Item("Task")
			.Def(4) = 18
			.Color = 0x1000000
		endwith
		with .Bars.Item("Summary")
			.Def(4) = 18
			.Color = 0x2000000
		endwith
		with .Bars.Copy("Summary","SummaryN")
			.Def(4) = 18
			.Color = 0x3000000
		endwith
	endwith
	with .Items
		hSummaryJ = .AddItem("Summary A")
		.AddBar(hSummaryJ,"Summary",{^2001-1-2},{^2001-1-2},"J")
		hTaskJ = .InsertItem(hSummaryJ,Null,"Task A.1")
		.AddBar(hTaskJ,"Task",{^2001-1-2},{^2001-1-5},"J1")
		hTaskJ = .InsertItem(hSummaryJ,Null,"Task A.2")
		.AddBar(hTaskJ,"Task",{^2001-1-4},{^2001-1-8},"J2")
		.DefineSummaryBars(hSummaryJ,"J",-1,"<*>")
		hSummaryK = .AddItem("Summary B")
		.AddBar(hSummaryK,"Summary",{^2001-1-2},{^2001-1-2},"K")
		hTaskK = .InsertItem(hSummaryK,Null,"Task B.1")
		.AddBar(hTaskK,"Task",{^2001-1-2},{^2001-1-5},"K1")
		hTaskK = .InsertItem(hSummaryK,Null,"Task B.2")
		.AddBar(hTaskK,"Task",{^2001-1-4},{^2001-1-8},"K2")
		.DefineSummaryBars(hSummaryK,"K",-1,"<*>")
		hSummaryN = .AddItem("Summary C")
		.AddBar(hSummaryN,"SummaryN",{^2001-1-2},{^2001-1-2},"SN")
		hTaskK = .InsertItem(hSummaryN,Null,"Task B.1")
		.AddBar(hTaskK,"Task",{^2001-1-2},{^2001-1-5},"N1")
		hTaskK = .InsertItem(hSummaryN,Null,"Task B.2")
		.AddBar(hTaskK,"Task",{^2001-1-4},{^2001-1-8},"N2")
		.DefineSummaryBars(hSummaryN,"SN",-1,"<*>")
		.ItemBar(0,"<K*>",33) = 255
		.ItemBar(0,"<N*>",33) = 8421504
		.ExpandItem(0) = .T.
	endwith
	.EndUpdate
endwith
|
|
2099
|
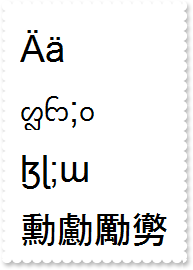
How can I display UNICODE characters
with thisform.G2antt1
	.BeginUpdate
	.Chart.PaneWidth(1) = 0
	with .Font
		.Name = "Arial Unicode"
		.Size = 22
	endwith
	.HeaderVisible = .F.
	.DefaultItemHeight = 48
	.Columns.Add("").Def(17) = 1
	with .Items
		.AddItem("Ӓӓ")
		.AddItem("ᦜᦝ;ᦞ")
		.AddItem("ɮɭ;ɯ")
		.AddItem("勳勴勵勶")
		.DefaultItem = .AddItem(thisform.G2antt1.Version)
		.FormatCell(0,0) = "(value lfind `UNICODE`) < 0 ? `<fgcolor=FF0000><b>!UNICODE!</b> version</fgcolor> required: ` + value : `` "
	endwith
	.EndUpdate
endwith
|
|
2098
|
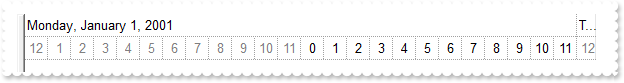
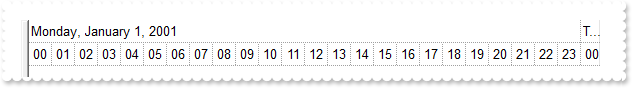
How can I display 12-hour time (method 2)
with thisform.G2antt1
	.BeginUpdate
	with .Chart
		.FirstVisibleDate = {^2001-1-1}
		.PaneWidth(0) = 0
		.LevelCount = 2
		.Level(0).Label = 4096
		with .Level(1)
			.Unit = 65536
			.FormatLabel = "(0 := hour(dvalue)) < 12 ? ( `<fgcolor=808080>` + ( =:0 = 0 ? 12 : =:0 ) + `</fgcolor>` ) : (=:0 - 12)"
		endwith
	endwith
	.EndUpdate
endwith
|
|
2097
|
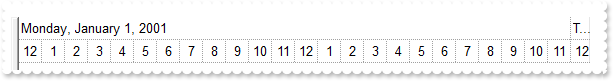
How can I display 12-hour time (method 1)
with thisform.G2antt1
	.BeginUpdate
	with .Chart
		.FirstVisibleDate = {^2001-1-1}
		.PaneWidth(0) = 0
		.LevelCount = 2
		.Level(0).Label = 4096
		.Level(1).Label = "<%h12%>"
	endwith
	.EndUpdate
endwith
|
|
2096
|
How do I scale to hours
with thisform.G2antt1
	.BeginUpdate
	with .Chart
		.FirstVisibleDate = {^2001-1-1}
		.PaneWidth(0) = 0
		.LevelCount = 2
		.Level(0).Label = 4096
		.Level(1).Label = 65536
	endwith
	.EndUpdate
endwith
|
|
2095
|
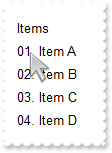
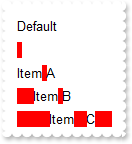
How do I display the position of the item with 0-padding
with thisform.G2antt1
	.BeginUpdate
	.Columns.Add("Items").FormatColumn = "((1 apos ``) lpad `00`) + `. `  + value"
	with .Items
		.AddItem("Item A")
		.AddItem("Item B")
		.AddItem("Item C")
		.AddItem("Item D")
	endwith
	.EndUpdate
endwith
|
|
2094
|
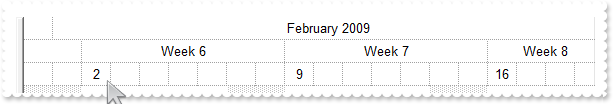
Can I format the label in row 3 below to show day numbers, only for Mondays each week (sample 2)

with thisform.G2antt1
	with .Chart
		.PaneWidth(0) = 0
		.FirstVisibleDate = {^2009-1-31}
		.LevelCount = 3
		.FirstWeekDay = 1
		with .Level(0)
			.Label = "<%mmmm%> <%yyyy%>"
			.Alignment = 1
			.Unit = 16
		endwith
		with .Level(1)
			.Unit = 256
			.Label = "Week <%ww%>"
			.Alignment = 1
		endwith
		with .Level(2)
			.Unit = 4096
			.FormatLabel = "weekday(dvalue) = 1 ? day(dvalue): ''"
		endwith
		.UnitWidth = 23
	endwith
endwith
|
|
2093
|
Can I format the label in row 3 below to show day numbers, only for Mondays each week (sample 1)
with thisform.G2antt1
	with .Chart
		.PaneWidth(0) = 0
		.FirstVisibleDate = {^2009-1-31}
		.LevelCount = 3
		.FirstWeekDay = 1
		with .Level(0)
			.Label = "<%mmmm%> <%yyyy%>"
			.Alignment = 1
			.Unit = 16
		endwith
		with .Level(1)
			.Unit = 256
			.Label = "Week <%ww%>"
			.Alignment = 1
		endwith
		with .Level(2)
			.Unit = 4096
			.FormatLabel = "weekday(dvalue) = 1 ? value : ''"
		endwith
		.UnitWidth = 23
	endwith
endwith
|
|
2092
|
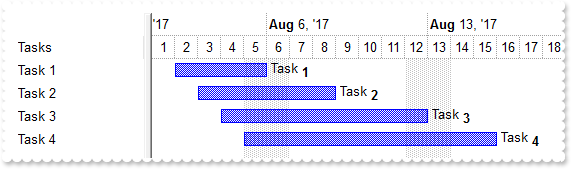
How can I change the caption for all bars
with thisform.G2antt1
	.BeginUpdate
	.Columns.Add("Tasks")
	with .Chart
		.FirstVisibleDate = {^2017-8-1}
		.LevelCount = 2
		.PaneWidth(0) = 128
		with .Bars.Add("Task%Progress")
			.Shortcut = "Task"
			.Def(14) = .T.
		endwith
	endwith
	with .Items
		.AddBar(.AddItem("Task 1"),"Task",{^2017-8-2},{^2017-8-6})
		.AddBar(.AddItem("Task 2"),"Task",{^2017-8-3},{^2017-8-9})
		.AddBar(.AddItem("Task 3"),"Task",{^2017-8-4},{^2017-8-13})
		.AddBar(.AddItem("Task 4"),"Task",{^2017-8-5},{^2017-8-16})
		.ItemBar(0,"<*>",14) = .F.
		.ItemBar(0,"<*>",3) = "<%= %C0 replace `Task` with `Task<off 4><b>` %>"
		.ItemBar(0,"<*>",4) = 18
	endwith
	.EndUpdate
endwith
|
|
2091
|
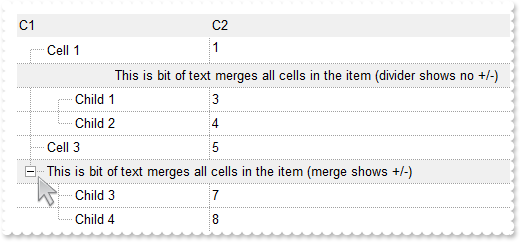
Can't get the +/- to be displayed on a divider item. What else can I do
with thisform.G2antt1
	.BeginUpdate
	.LinesAtRoot = -1
	.DrawGridLines = -1
	.TreeColumnIndex = 0
	.MarkSearchColumn = .F.
	.FullRowSelect = 0
	.HeaderAppearance = -1 && 0xfffffff8 Or AppearanceEnum.Bump Or AppearanceEnum.Sunken
	.Chart.PaneWidth(1) = 0
	with .Columns
		.Add("C1").Width = 32
		.Add("C2").FormatColumn = "1 index ``"
	endwith
	with .Items
		h = .AddItem("Cell 1")
		.DefaultItem = h
		.CellSingleLine(0,1) = .F.
		h = .AddItem("This is bit of text merges all cells in the item (divider shows no +/-)")
		.DefaultItem = h
		.ItemDivider(0) = 0
		.DefaultItem = h
		.ItemBackColor(0) = RGB(240,240,240)
		.DefaultItem = h
		.ItemDividerLine(0) = 0
		.DefaultItem = h
		.CellHAlignment(0,0) = 1
		.InsertItem(h,Null,"Child 1")
		.InsertItem(h,Null,"Child 2")
		.DefaultItem = h
		.ExpandItem(0) = .T.
		h = .AddItem("Cell 3")
		h = .AddItem("This is bit of text merges all cells in the item (merge shows +/-)")
		.DefaultItem = h
		.ItemBackColor(0) = RGB(240,240,240)
		.DefaultItem = h
		.CellMerge(0,0) = 1
		.InsertItem(h,Null,"Child 3")
		.InsertItem(h,Null,"Child 4")
		.DefaultItem = h
		.ExpandItem(0) = .T.
	endwith
	.EndUpdate
endwith
|
|
2090
|
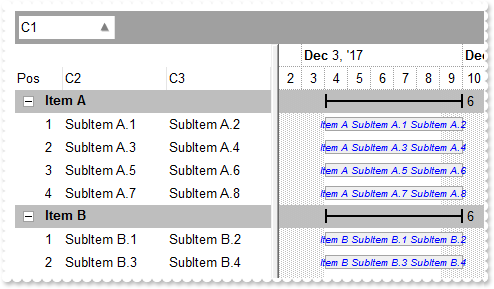
How can I display one or more columns on the same bar
*** AddGroupItem event - Occurs after a new Group Item has been inserted to Items collection. ***
LPARAMETERS Item
	with thisform.G2antt1
		with .Items
			.DefaultItem = Item
			.ItemDividerLine(0) = 0
			.AddBar(Item,"Summary",{^2017-12-2},{^2017-12-2})
			.DefineSummaryBars(Item,"",-3,"")
			l = .GroupItem(Item)
			.DefaultItem = Item
			.CellSingleLine(0,l) = .F.
			.DefaultItem = Item
			.CellBold(0,l) = .T.
			.DefaultItem = Item
			.ItemBackColor(0) = RGB(190,190,190)
		endwith
		.DefaultItem = Item
		.Chart.ItemBackColor(0) = RGB(190,190,190)
	endwith

*** AddItem event - Occurs after a new Item has been inserted to Items collection. ***
LPARAMETERS Item
	with thisform.G2antt1
		.Items.AddBar(Item,"Task",{^2017-12-4},{^2017-12-10})
	endwith

with thisform.G2antt1
	.BeginUpdate
	var_s = "gBFLBCJwBAEHhEJAAEhABOUGACAADACAxRDgMQBQKAAzAJBIYhiG4cYCgMZhXDOCYXABCEYRXBIZQ7BKNIxjSJwFgmEgADCMQwAFBIbhrE4ZBjHGQRUgyI43RhHUBzVI"
	var_s = var_s + "UBxDEaTZLlEYJBgeHYhDJPcaUVDcWQHGyeZwjSgpKoWSJIU5NcggPDgEwTKCmKlTAKoSzJMyEmwWRAdVTZLSEaxierKPhyWT/XgAF4PfDFKRXFqXY5mKZJFqKOI8TxIN"
	var_s = var_s + "gxPQMGyrBqraLqKwQGrGCQKSBhUZ3dS2JR3OSlYRuQAMVgOXoDZhPWZXbDtSzPE63NgtOR5DiGWalABoeoxRa9cz3ViCJSrGTqIoINIzZLHFQbPpdAYdP6BeIjXhhZxB"
	var_s = var_s + "BuLZXmEOh9CcNoni2N4MjWVodh+DpfBeLJinsWR9AyYwVAkGBhEAFphGiRogDEGBamkFgtjcZgHiMbgehYaQhAIEIREAaQYkcQZUHIGRUGQDBOEaBAhDYDxGkMZAkCge"
	var_s = var_s + "oagYZAYEYAYIAWGhemICIFj8WIiCiFR5gkIhogmBoKGKJx2C6C5hniMgggqYwog0UoNGMZJiDiCZRgOLY0ECUAQICA=="
	.VisualAppearance.Add(1,var_s)
	with .Chart
		.LevelCount = 2
		.FirstVisibleDate = {^2017-12-2}
		.PaneWidth(0) = 256
		with .Bars.Item("Summary")
			.StartShape = 0
			.EndShape = 0
			.Shape = 1
			.Color = 0x1000000
			.Def(3) = "<%=%513%>"
			.Def(4) = 18
		endwith
		with .Bars.Item("Task")
			.Pattern = 32
			.Color = RGB(164,164,164)
			.StartColor = RGB(240,240,240)
			.EndColor = .StartColor
			.Def(3) = "<%= `<font ;6><fgcolor=0000FF><i>` + %C0 + ` ` + %C1 + ` ` + %C2 %>"
			.Def(4) = 13
		endwith
	endwith
	with .Columns
		.Add("C1")
		.Add("C2").Editor.EditType = 1
		.Add("C3").Editor.EditType = 1
		with .Add("Pos")
			.FormatColumn = "1 pos ``"
			.AllowGroupBy = .F.
			.Position = 0
			.Width = 48
			.AllowSizing = .F.
		endwith
	endwith
	.SortBarVisible = .T.
	.SortBarCaption = "Drag a <b>column</b> header here to group by that column."
	.AllowGroupBy = .T.
	.HasLines = 0
	.LinesAtRoot = 0
	with .Items
		h = .AddItem("Item A")
		.DefaultItem = h
		.CellValue(0,1) = "SubItem A.1"
		.DefaultItem = h
		.CellValue(0,2) = "SubItem A.2"
		h = .AddItem("Item A")
		.DefaultItem = h
		.CellValue(0,1) = "SubItem A.3"
		.DefaultItem = h
		.CellValue(0,2) = "SubItem A.4"
		h = .AddItem("Item A")
		.DefaultItem = h
		.CellValue(0,1) = "SubItem A.5"
		.DefaultItem = h
		.CellValue(0,2) = "SubItem A.6"
		h = .AddItem("Item A")
		.DefaultItem = h
		.CellValue(0,1) = "SubItem A.7"
		.DefaultItem = h
		.CellValue(0,2) = "SubItem A.8"
		h = .AddItem("Item B")
		.DefaultItem = h
		.CellValue(0,1) = "SubItem B.1"
		.DefaultItem = h
		.CellValue(0,2) = "SubItem B.2"
		h = .AddItem("Item B")
		.DefaultItem = h
		.CellValue(0,1) = "SubItem B.3"
		.DefaultItem = h
		.CellValue(0,2) = "SubItem B.4"
	endwith
	with .Columns.Item(0)
		.SortOrder = 1
	endwith
	.EndUpdate
endwith
|
|
2089
|
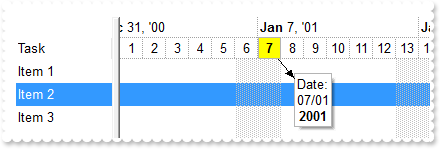
How can I associate a box/note to a date into the control's header
with thisform.G2antt1
	.BeginUpdate
	.ScrollBySingleLine = .T.
	.Columns.Add("Task")
	.HeaderHeight = 17
	with .Chart
		.FirstVisibleDate = {^2001-1-1}
		.PaneWidth(0) = 96
		.LevelCount = 2
		.SelBackColor = thisform.G2antt1.SelBackColor
	endwith
	with .Items
		.AddItem("Item 1")
		.DefaultItem = .AddItem("Item 2")
		.SelectItem(0) = .T.
		.AddItem("Item 3")
	endwith
	with .Chart.Notes
		with thisform.G2antt1.Items
			.LockedItemCount(0) = 1
			hLocked = .LockedItem(0,0)
			.DefaultItem = hLocked
			.ItemHeight(0) = 1
		endwith
		with .Add("header",hLocked,{^2001-1-7},"Date:<br><%dd%>/<%mm%><br><b><%yyyy%></b>")
			.PartVisible(0) = .T.
			.PartText(0) = "<b><%d%></b>"
			.PartCanMove(1) = .T.
			.PartCanMove(0) = .T.
			.PartVOffset(0) = -9
			.PartVOffset(1) = 20
			.PartHOffset(1) = 20
			.PartBackColor(0) = RGB(255,255,0)
			.PartFixedWidth(0) = 18
		endwith
	endwith
	.EndUpdate
endwith
|
|
2088
|
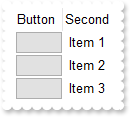
How can I define a column of button type
*** ButtonClick event - Occurs when user clicks on the cell's button. ***
LPARAMETERS Item, ColIndex, Key
	with thisform.G2antt1
		with .Items
			DEBUGOUT( .CellValue(Item,ColIndex) )
		endwith
	endwith

with thisform.G2antt1
	.BeginUpdate
	with .Columns.Add("Button")
		.Def(2) = .T.
		.Def(3) = .F.
		.FormatColumn = "``"
		.AllowSizing = .F.
		.Width = 48
	endwith
	.Columns.Add("Second").FormatColumn = "` Item ` + 1 index ``"
	with .Items
		.AddItem("Button 1")
		.AddItem("Button 2")
		.AddItem("Button 3 ")
	endwith
	.EndUpdate
endwith
|
|
2087
|
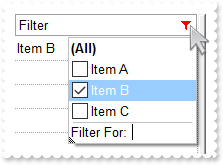
Is it possible to configure different colour/icon when there is a active filter
*** FilterChange event - Occurs when the filter was changed. ***
LPARAMETERS nop
	with thisform.G2antt1
		.Object.Background(0) = .FormatABC("value = 0 ? 0x1000001 : 0x10000FF ",.Columns.Item(0).FilterType)
	endwith

with thisform.G2antt1
	.BeginUpdate
	with .VisualAppearance
		.RenderType = -16777216
		var_s = "gBFLBCJwBAEHhEJAAEhABXUIQAAYAQGKIcBiAKBQAGYBIJDEMgzDDAUBjKKocQTC4AIQjCK4JDKHYJRpHEZyCA8EhqGASRAFUQBYiWE4oSpLABQaK0ZwIGyRIrkGQgQg"
		var_s = var_s + "mPYDSDNU4zVIEEglBI0TDNczhNDENgtGYaJqHIYpZBcM40TKkEZoSIITZcRrOEBiRL1S0RBhGcRUHZlWzdN64LhuK47UrWdD/XhdVzXRbjfz1Oq+bxve48Br7A5yYThd"
		var_s = var_s + "r4LhOFQ3RjIL4xbIcUwGe6VZhjOLZXjmO49T69HTtOCYBEBA"
		.Add(1,var_s)
	endwith
	.DrawGridLines = -1
	.ShowFocusRect = .F.
	.Object.Background(0) = 0x1000001
	.Object.Background(32) = -1
	.HeaderAppearance = 4
	.BackColorHeader = RGB(255,255,255)
	.HeaderVisible = 1
	with .Columns.Add("Filter")
		.DisplayFilterButton = .T.
		.AllowSort = .F.
		.AllowDragging = .F.
		.FilterList = 256
	endwith
	with .Items
		.AddItem("Item A")
		.AddItem("Item B")
		.AddItem("Item C")
	endwith
	with .Columns.Item(0)
		.Filter = "Item B"
		.FilterType = 240
	endwith
	.ApplyFilter
	.EndUpdate
endwith
|
|
2086
|
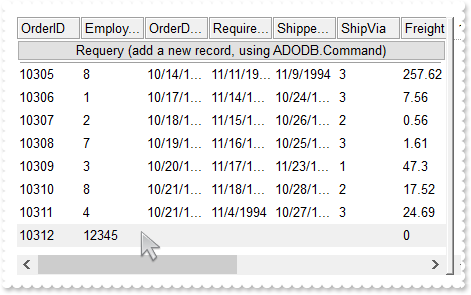
ADODB Requery sample
*** ButtonClick event - Occurs when user clicks on the cell's button. ***
LPARAMETERS Item, ColIndex, Key
	with thisform.G2antt1
		cmd = CreateObject("ADODB.Command")
		with cmd
			.ActiveConnection = thisform.G2antt1.DataSource.ActiveConnection
			.CommandText = "INSERT INTO Orders (EmployeeID) VALUES(12345)"
			.CommandType = 1
			.Execute()
		endwith
		.DataSource.Requery()
	endwith

*** Error event - Fired when an internal error occurs. ***
LPARAMETERS Error, Description
	with thisform.G2antt1
		DEBUGOUT( Description )
	endwith

with thisform.G2antt1
	.BeginUpdate
	.HeaderAppearance = 4
	.ColumnAutoResize = .F.
	rs = CreateObject("ADODB.Recordset")
	with rs
		.Open("Select * From Orders","Provider=Microsoft.ACE.OLEDB.12.0;Data Source=C:\Program Files\Exontrol\ExG2antt\Sample\Access\misc.accdb",1,3)
	endwith
	.DataSource = rs
	.ConditionalFormats.Add("%1=12345").BackColor = RGB(240,240,240)
	with .Items
		.LockedItemCount(0) = 1
		h = .LockedItem(0,0)
		.DefaultItem = h
		.ItemDivider(0) = 0
		.DefaultItem = h
		.CellHasButton(0,0) = .T.
		.DefaultItem = h
		.CellValue(0,0) = "Requery (add a new record, using ADODB.Command)"
		.DefaultItem = h
		.CellHAlignment(0,0) = 1
	endwith
	.EndUpdate
endwith
|
|
2085
|
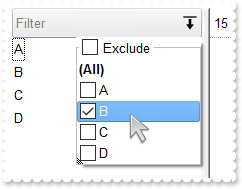
I am skinning the control's header-bar, but the background of the header-bar is shown on each item in the filter-bar drop down panel. What can I do
with thisform.G2antt1
	.BeginUpdate
	with .VisualAppearance
		var_s = "gBFLBCJwBAEHhEJAAEhABFgDg6AADACAxRDgMQBQKAAzQFAYcBqGqGAAGQZxYgmFgAQhFcZQSKUOQTDKMIziYBYfgkMIgSbJUgDGAkRRdDSOYDmGQYDiCIoRShOMIjHL"
		var_s = var_s + "UXxtDaIZwhEAoJb+RgAUY/cTzaAEUwHHiTKInaCQGhsCYJUJAdRURQ9EwvCIZBpEWwLChENQwWLCNj2TScBwjCyqbale45ViqdoDU8lORLUi+M4zSBPcZVTRtGShPDBK"
		var_s = var_s + "TjMKKYgkG4lVpRNa0PC1GTzQ6mazkKQLRADDIDVbAeL3LiMBy9LyLLItQALByua5mWhbcZyBCOPgBTrRb5zO58FjuTK7YLjMB7NrUNYtFaUMy2OpOCADIaecTNcaWLxP"
		var_s = var_s + "F2MY1HWYxVj2Jw3DuRJonKYBgggSRAlIYw6B0ThGFgPAkFUDAhBMfZRiGNAkFECZnm4YQdneJwqnsSQrGAAhWAIJBJBIQgFCQIBiEIAglgqYo0i4V4MEgRI9gSToYFSb"
		var_s = var_s + "4Fk6Y4+BmBZhFOJgTC8TBogQAArgqco4muCZOkOMJtgmYpIjYKg7GKE4uCUK4AAKKg2DwI4DiCZw5k6KJ2D6D4OHiag4DwIxiiQAArAqMosnEPBPAOIhOg+DozjIJ4PG"
		var_s = var_s + "SY4iEwPAkhKLhHUUSQsnKFCnkYU9MjORhcCsAAIACLQ8iaSJ6FKC5jJoaobA8KYoACCRKnmMJzhuDpZnSboMCKGJ4nMPIPDmYAACwKIDk6CoLCeU40m6I5oliMoKDyaI"
		var_s = var_s + "CokLIpgoThviOKJoGYf4KmUKhMjMLJLCAAojCyaYoiYGoGmqM46CkOwPEoKonAACxKlSdItmiWBeBeDgrioNo3D0KxSlAAAtgsUpYnUPRPEoco8hCa+T40SxbBRj5tEs"
		var_s = var_s + "HJ1i6JhbGYS4ug8awelQLZAAKZI5C4DxrhYQ9ehmUppWiA48nAPRuFKYpiAAC47laZQ9iuKZSgOPotkuFI7C6C4gACPJAm8eQOhOQZoikDp3kCS5AACPoEk8fBGnqQgp"
		var_s = var_s + "DOSppD2TxjlyPZD6CfwekQTx5lKP5ImseZTCAL5MAMAAAkoTADmMLpIjISp+HSS4PgyMAADBzAHDSIoPCOUpWjObIKE8NJOHKIwPEaTprBsHpdjWLB9AieQ+DQYwQAAM"
		var_s = var_s + "R1EOZxWi+bx7HcWQ8msfRYnnDhQACRwxgwc5rGaMZPE0ZxqjWNZtgyRwAAyTZEnuXJzEyAx2kQcxNkye5cEy3cYAcANrGAIH4OAhx3gNGGPAfgIR8jBA4McBMARViHH4"
		var_s = var_s + "HQOYmxuCpF2MsecEQVBvGQCcIQvA6i2CAAIARAQ="
		.Add(1,var_s)
		var_s1 = "gBFLBCJwBAEHhEJAAEhABZEGACAADACAxRDgMQBQKAAzQFAYcBqGqGAAGQZxYgmFgAQhFcZQSKUOQTDKMIziYBYJhEMwwDhEIwjHCEEhsGIbJAGQBJCjWGodQLOEgzNC"
		var_s1 = var_s1 + "0IxNFCQILhEZJADKII8TTOU5UPRESwTE4cKBmKhQCo2NpKR7VUTxCKQahLLivoCjBT8EzHMqtIzrCA6MpaP4pQjKcqwHJ8YyHEi0ZrjazKaj6T5AXDUcaWbbNVx3PK3a"
		var_s1 = var_s1 + "ioOpLZrqOZZYzYFoABTuJzPMSyIhxXD8cweaZvSpLExVYK9BY3PbKMgxC77QgTIpDaQMNS6PjtF43PAALLFUaNYzoOKzABMHATBIXAYJCwIIR5G7ID4BbQcCQAHL9DBa"
		var_s1 = var_s1 + "EEIAEEISgGhMGZQmocgymmIRQkIEQ2BcGgbEIRQci8XaMBqTRVgSAZHG+S5pnOep+D6f4vjec5zn0fpfmgBgAH6TRoBYBoAh+eAmAiAgPFgNArgOQpIESdoEmCOAOAqB"
		var_s1 = var_s1 + "YfFGAgaEaBgYHYFYFmIB5UiGCJUgKCgmgeYoHk4BgCmKRQiCwApgHgYgyH8B54lQU4NkMeJlBoDgjkiXBTg0R54iYIR+koeQVBoKpkgkChKhEJBkF4SFEjkDgJhFQoeE"
		var_s1 = var_s1 + "mDJlBeehUhWJQJGIXoICWOQ6FeFIlhkfhlDsSJpiQVoamaSY2G6G5nAmRhpCOH5pkwVYdmeCZmHqHpnkmdhzhmaAIFiax8AABAEICA=="
		.Add(2,var_s1)
	endwith
	.BackColorHeader = 0x1000000
	.ForeColorHeader = RGB(128,128,128)
	.Object.Background(0) = 0x2000000
	.Object.Background(26) = RGB(255,255,255)
	.Object.Background(27) = RGB(0,0,1)
	.Object.Background(20) = 0x1ff8000
	.Object.Background(21) = RGB(240,240,240)
	.Object.Background(32) = -1
	.HeaderHeight = 24
	.BackColorLevelHeader = .BackColor
	with .Columns.Add("Filter")
		.DisplayFilterButton = .T.
		.DisplayFilterPattern = .F.
		.FilterList = 9504 && FilterListEnum.exShowExclude Or FilterListEnum.exShowFocusItem Or FilterListEnum.exShowCheckBox Or FilterListEnum.exSortItemsAsc
		.Def(52) = 2
		.Def(53) = 2
	endwith
	with .Items
		.AddItem("A")
		.AddItem("B")
		.AddItem("C")
		.AddItem("D")
	endwith
	.EndUpdate
endwith
|
|
2084
|
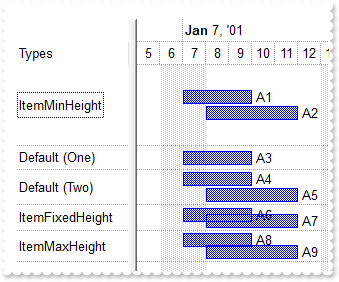
I specify the ItemHeight for each row, but as soon as I click the chart section, the item's height is restored to default (not working). What could be the cause
with thisform.G2antt1
	.BeginUpdate
	.ScrollBySingleLine = .T.
	.Columns.Add("Types")
	.DrawGridLines = 1
	with .Chart
		.LevelCount = 2
		.DrawGridLines = 1
		.AllowCreateBar = 1
		.AllowLinkBars = .F.
		.ResizeUnitScale = 65536
		.PaneWidth(0) = 112
		.FirstVisibleDate = {^2001-1-1}
		with .Bars.Item("Task")
			.OverlaidType = 3
			.Def(3) = "<%=%9%>"
			.Def(4) = 18
		endwith
	endwith
	with .Items
		h = .AddItem("ItemMinHeight")
		.AddBar(h,"Task",{^2001-1-7},{^2001-1-10},"A1")
		.AddBar(h,"Task",{^2001-1-8},{^2001-1-12},"A2")
		.DefaultItem = h
		.ItemMinHeight(0) = 64
		.AddBar(.AddItem("Default (One)"),"Task",{^2001-1-7},{^2001-1-10},"A3")
		h = .AddItem("Default (Two)")
		.AddBar(h,"Task",{^2001-1-7},{^2001-1-10},"A4")
		.AddBar(h,"Task",{^2001-1-8},{^2001-1-12},"A5")
		h = .AddItem("ItemFixedHeight")
		.AddBar(h,"Task",{^2001-1-7},{^2001-1-10},"A6")
		.AddBar(h,"Task",{^2001-1-8},{^2001-1-12},"A7")
		.DefaultItem = h
		.ItemMinHeight(0) = 20
		.DefaultItem = h
		.ItemMaxHeight(0) = 20
		h = .AddItem("ItemMaxHeight")
		.AddBar(h,"Task",{^2001-1-7},{^2001-1-10},"A8")
		.AddBar(h,"Task",{^2001-1-8},{^2001-1-12},"A9")
		.DefaultItem = h
		.ItemMaxHeight(0) = 24
	endwith
	.EndUpdate
endwith
|
|
2083
|
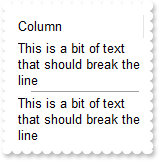
The ItemHeight property is not working (method 2)
with thisform.G2antt1
	.BeginUpdate
	.ColumnAutoResize = .F.
	.ScrollBySingleLine = .T.
	.Columns.Add("Column").Width = 128
	with .Items
		.DefaultItem = .AddItem("This is a bit of text that should break the line")
		.CellSingleLine(0,0) = 0
		h = .AddItem("")
		.DefaultItem = h
		.ItemDivider(0) = 0
		.DefaultItem = h
		.SelectableItem(0) = .F.
		.DefaultItem = h
		.ItemDividerLineAlignment(0) = 1
		.DefaultItem = h
		.ItemHeight(0) = 3
		.DefaultItem = .AddItem("This is a bit of text that should break the line")
		.CellSingleLine(0,0) = 0
	endwith
	.EndUpdate
endwith
|
|
2082
|
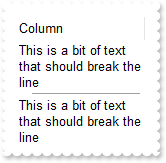
The ItemHeight property is not working (method 1)
with thisform.G2antt1
	.BeginUpdate
	.ColumnAutoResize = .F.
	.ScrollBySingleLine = .T.
	with .Columns.Add("Column")
		.Width = 128
		.Def(16) = 0
	endwith
	with .Items
		.AddItem("This is a bit of text that should break the line")
		h = .AddItem("")
		.DefaultItem = h
		.ItemDivider(0) = 0
		.DefaultItem = h
		.SelectableItem(0) = .F.
		.DefaultItem = h
		.ItemDividerLineAlignment(0) = 1
		.DefaultItem = h
		.ItemMinHeight(0) = 3
		.DefaultItem = h
		.ItemMaxHeight(0) = 3
		.AddItem("This is a bit of text that should break the line")
	endwith
	.EndUpdate
endwith
|
|
2081
|
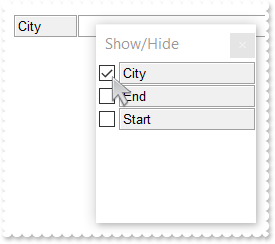
How do I use the ColumnsFloatBarVisible on exColumnsFloatBarVisibleIncludeCheckColumns
with thisform.G2antt1
	.BeginUpdate
	.ColumnAutoResize = .F.
	.HeaderAppearance = 4
	with .Columns
		.Add("City")
		.Add("Start").Visible = .F.
		.Add("End").Visible = .F.
	endwith
	.Object.Description(26) = "Show/Hide"
	.ColumnsFloatBarSortOrder = 1
	.ColumnsFloatBarVisible = 2
	.EndUpdate
endwith
|
|
2080
|
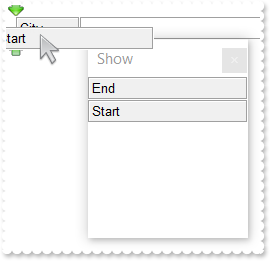
How do I use the ColumnsFloatBarVisible on exColumnsFloatBarVisibleIncludeHiddenColumn
with thisform.G2antt1
	.BeginUpdate
	.ColumnAutoResize = .F.
	.HeaderAppearance = 4
	with .Columns
		.Add("City")
		.Add("Start").Visible = .F.
		.Add("End").Visible = .F.
	endwith
	.Object.Description(26) = "Show"
	.ColumnsFloatBarVisible = -1
	.ColumnsFloatBarSortOrder = 1
	.EndUpdate
endwith
|
|
2079
|
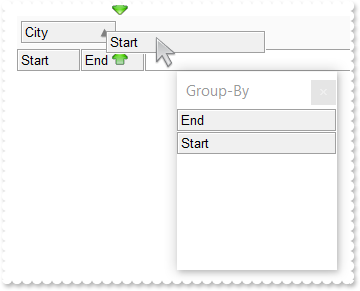
How do I use the ColumnsFloatBarVisible on exColumnsFloatBarVisibleIncludeGroupByColumns
with thisform.G2antt1
	.BeginUpdate
	.ColumnAutoResize = .F.
	.HeaderAppearance = 4
	with .Columns
		.Add("City")
		.Add("Start")
		.Add("End")
	endwith
	.AllowGroupBy = .T.
	.SortBarVisible = .T.
	.SortBarCaption = "Drag a <b>column</b> header here to group by that column."
	.BackColorSortBar = RGB(250,250,250)
	.Object.Description(26) = "Group-By"
	.ColumnsFloatBarVisible = 1
	.ColumnsFloatBarSortOrder = 1
	.Columns.Item("City").SortOrder = 1
	.EndUpdate
endwith
|
|
2078
|
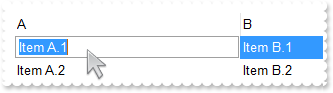
How can I advance to the next line, once the user presses the ENTER key
*** KeyDown event - Occurs when the user presses a key while an object has the focus. ***
LPARAMETERS KeyCode, Shift
	with thisform.G2antt1
		DEBUGOUT( "KeyCode Before:" )
		DEBUGOUT( KeyCode )
		KeyCode = .FormatABC("value = 13 ? 40 : value",KeyCode)
		DEBUGOUT( "KeyCode After:" )
		DEBUGOUT( KeyCode )
	endwith

with thisform.G2antt1
	.BeginUpdate
	with .Columns
		with .Add("A").Editor
			.Appearance = 4
			.EditType = 1
		endwith
		with .Add("B").Editor
			.Appearance = 4
			.EditType = 1
		endwith
	endwith
	with .Items
		h0 = .AddItem("Item A.1")
		.DefaultItem = h0
		.CellValue(0,1) = "Item B.1"
		h0 = .AddItem("Item A.2")
		.DefaultItem = h0
		.CellValue(0,1) = "Item B.2"
	endwith
	.EndUpdate
endwith
|
|
2077
|
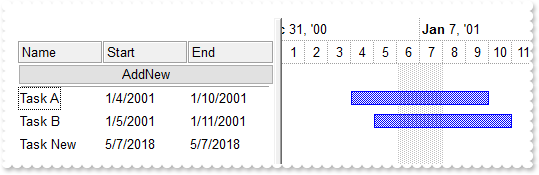
I am using AddNew to add new records, but I can not see them into the control
*** AddItem event - Occurs after a new Item has been inserted to Items collection. ***
LPARAMETERS Item
	with thisform.G2antt1
		with .Items
			.AddBar(Item,"Task",.CellValue(Item,1),.CellValue(Item,2))
		endwith
	endwith

*** ButtonClick event - Occurs when user clicks on the cell's button. ***
LPARAMETERS Item, ColIndex, Key
	with thisform.G2antt1
		with .DataSource
			.AddNew()
			.Fields.Item("Name").Value = "Task New"
			.Update()
		endwith
	endwith

with thisform.G2antt1
	.BeginUpdate
	.HeaderAppearance = 4
	rs = CreateObject("ADODB.Recordset")
	with rs
		with .Fields
			.Append("Name",8)
			.Append("Start",7)
			.Append("End",7)
		endwith
		.Open()
		.AddNew()
		.Fields.Item("Name").Value = "Task A"
		.Fields.Item("Start").Value = {^2001-1-4}
		.Fields.Item("End").Value = {^2001-1-10}
		.Update()
		.AddNew()
		.Fields.Item("Name").Value = "Task B"
		.Fields.Item("Start").Value = {^2001-1-5}
		.Fields.Item("End").Value = {^2001-1-11}
		.Update()
	endwith
	.DataSource = rs
	with .Chart
		.FirstVisibleDate = {^2001-1-1}
		.LevelCount = 2
		.PaneWidth(0) = 256
	endwith
	.Items.AllowCellValueToItemBar = .T.
	.Columns.Item("Start").Def(18) = 1
	.Columns.Item("End").Def(18) = 2
	with .Items
		.LockedItemCount(0) = 1
		h = .LockedItem(0,0)
		.DefaultItem = h
		.ItemDivider(0) = 0
		.DefaultItem = h
		.CellHasButton(0,0) = .T.
		.DefaultItem = h
		.CellValue(0,0) = "AddNew"
		.DefaultItem = h
		.CellHAlignment(0,0) = 1
	endwith
	.DetectAddNew = .T.
	.DetectDelete = .T.
	.EndUpdate
endwith
|
|
2076
|
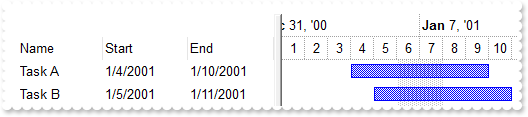
How can I create a new ADO recordset
*** AddItem event - Occurs after a new Item has been inserted to Items collection. ***
LPARAMETERS Item
	with thisform.G2antt1
		with .Items
			.AddBar(Item,"Task",.CellValue(Item,1),.CellValue(Item,2))
		endwith
	endwith

with thisform.G2antt1
	.BeginUpdate
	rs = CreateObject("ADODB.Recordset")
	with rs
		with .Fields
			.Append("Name",8)
			.Append("Start",7)
			.Append("End",7)
		endwith
		.Open()
		.AddNew()
		.Fields = "Task A"
		.Fields = {^2001-1-4}
		.Fields = {^2001-1-10}
		.Update()
		.AddNew()
		.Fields = "Task B"
		.Fields = {^2001-1-5}
		.Fields = {^2001-1-11}
		.Update()
	endwith
	.DataSource = rs
	with .Chart
		.FirstVisibleDate = {^2001-1-1}
		.LevelCount = 2
		.PaneWidth(0) = 256
	endwith
	.Items.AllowCellValueToItemBar = .T.
	.Columns.Item("Start").Def(18) = 1
	.Columns.Item("End").Def(18) = 2
	.EndUpdate
endwith
|
|
2075
|
Do do I get the DAO version I have installed

with thisform.G2antt1
	DEBUGOUT( CreateObject("DAO.DBEngine.35").Version.Version )
	DEBUGOUT( CreateObject("DAO.DBEngine.36").Version.Version )
	DEBUGOUT( CreateObject("DAO.DBEngine.120").Version.Version )
endwith
|
|
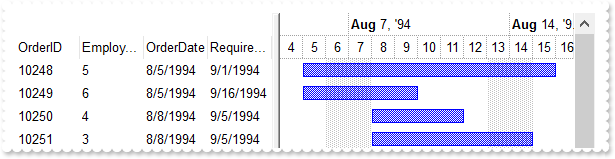
2074
|
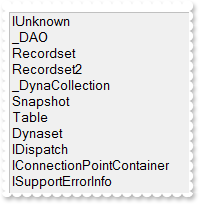
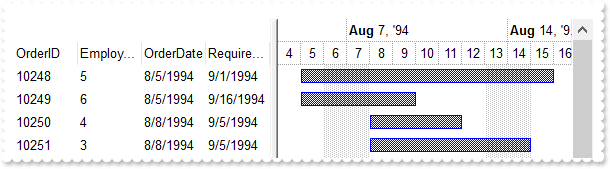
How do I get a list of interfaces the object implemenets
*** AddItem event - Occurs after a new Item has been inserted to Items collection. ***
LPARAMETERS Item
	with thisform.G2antt1
		with .Items
			.AddBar(Item,"Task",.CellValue(Item,2),.CellValue(Item,4))
		endwith
	endwith

with thisform.G2antt1
	.BeginUpdate
	.ColumnAutoResize = .F.
	with CreateObject("DAO.DBEngine.120")
		rs = .OpenDatabase("C:\Program Files\Exontrol\ExG2antt\Sample\Access\misc.accdb").OpenRecordset("Orders")
	endwith
	DEBUGOUT( CreateObject("Exontrol.PropertiesList") )
	.DataSource = rs
	with .Chart
		.FirstVisibleDate = {^1994-8-4}
		.LevelCount = 2
		.PaneWidth(0) = 256
	endwith
	.Items.AllowCellValueToItemBar = .T.
	.Columns.Item(2).Def(18) = 1
	.Columns.Item(4).Def(18) = 2
	.EndUpdate
endwith
|
|
2073
|
Do do I get the ADO version I have installed
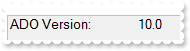
with thisform.G2antt1
	DEBUGOUT( "ADO Version:" )
	DEBUGOUT( CreateObject("ADODB.Connection").Version.Version )
endwith
|
|
2072
|
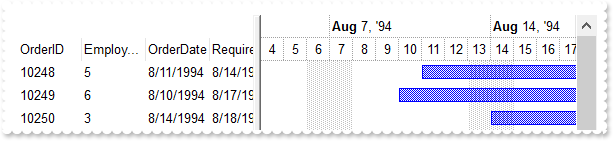
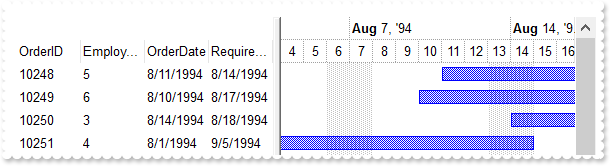
DAO, ACCDB, 120
*** AddItem event - Occurs after a new Item has been inserted to Items collection. ***
LPARAMETERS Item
	with thisform.G2antt1
		with .Items
			.AddBar(Item,"Task",.CellValue(Item,2),.CellValue(Item,4))
		endwith
	endwith

with thisform.G2antt1
	.BeginUpdate
	.ColumnAutoResize = .F.
	with CreateObject("DAO.DBEngine.120")
		rs = .OpenDatabase("C:\Program Files\Exontrol\ExG2antt\Sample\Access\misc.accdb").OpenRecordset("Orders")
	endwith
	.DataSource = rs
	with .Chart
		.FirstVisibleDate = {^1994-8-4}
		.LevelCount = 2
		.PaneWidth(0) = 256
	endwith
	.Items.AllowCellValueToItemBar = .T.
	.Columns.Item(2).Def(18) = 1
	.Columns.Item(4).Def(18) = 2
	.EndUpdate
endwith
|
|
2071
|
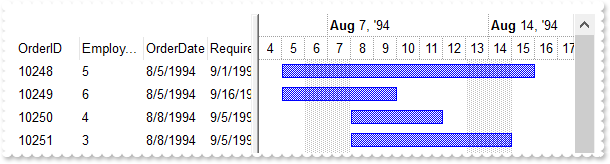
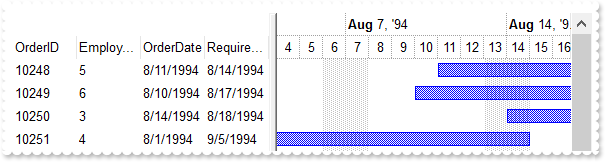
DAO, MDB, 120
*** AddItem event - Occurs after a new Item has been inserted to Items collection. ***
LPARAMETERS Item
	with thisform.G2antt1
		with .Items
			.AddBar(Item,"Task",.CellValue(Item,2),.CellValue(Item,4))
		endwith
	endwith

with thisform.G2antt1
	.BeginUpdate
	.ColumnAutoResize = .F.
	with CreateObject("DAO.DBEngine.120")
		rs = .OpenDatabase("C:\Program Files\Exontrol\ExG2antt\sample\Access\misc.mdb").OpenRecordset("Orders")
	endwith
	.DataSource = rs
	with .Chart
		.FirstVisibleDate = {^1994-8-4}
		.LevelCount = 2
		.PaneWidth(0) = 256
	endwith
	.Items.AllowCellValueToItemBar = .T.
	.Columns.Item(2).Def(18) = 1
	.Columns.Item(4).Def(18) = 2
	.EndUpdate
endwith
|
|
2070
|
DAO, MDB
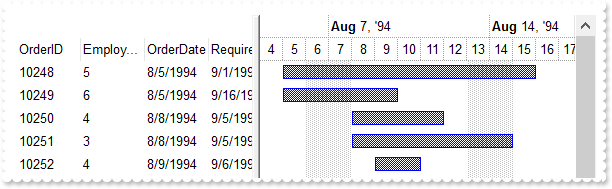
*** AddItem event - Occurs after a new Item has been inserted to Items collection. ***
LPARAMETERS Item
	with thisform.G2antt1
		with .Items
			.AddBar(Item,"Task",.CellValue(Item,2),.CellValue(Item,4))
		endwith
	endwith

with thisform.G2antt1
	.BeginUpdate
	.ColumnAutoResize = .F.
	with CreateObject("DAO.DBEngine.36")
		rs = .OpenDatabase("C:\Program Files\Exontrol\ExG2antt\sample\Access\misc.mdb").OpenRecordset("Orders")
	endwith
	.DataSource = rs
	with .Chart
		.FirstVisibleDate = {^1994-8-4}
		.LevelCount = 2
		.PaneWidth(0) = 256
	endwith
	.Items.AllowCellValueToItemBar = .T.
	.Columns.Item(2).Def(18) = 1
	.Columns.Item(4).Def(18) = 2
	.EndUpdate
endwith
|
|
2069
|
ADODB, ACCDB, x64
*** AddItem event - Occurs after a new Item has been inserted to Items collection. ***
LPARAMETERS Item
	with thisform.G2antt1
		with .Items
			.AddBar(Item,"Task",.CellValue(Item,2),.CellValue(Item,4))
		endwith
	endwith

with thisform.G2antt1
	.BeginUpdate
	.ColumnAutoResize = .F.
	rs = CreateObject("ADODB.Recordset")
	with rs
		.Open("Orders","Provider=Microsoft.ACE.OLEDB.12.0;Data Source=C:\Program Files\Exontrol\ExG2antt\Sample\Access\misc.accdb",1,1)
	endwith
	.DataSource = rs
	with .Chart
		.FirstVisibleDate = {^1994-8-4}
		.LevelCount = 2
		.PaneWidth(0) = 256
	endwith
	.Items.AllowCellValueToItemBar = .T.
	.Columns.Item(2).Def(18) = 1
	.Columns.Item(4).Def(18) = 2
	.EndUpdate
endwith
|
|
2068
|
ADOR, ACCDB
*** AddItem event - Occurs after a new Item has been inserted to Items collection. ***
LPARAMETERS Item
	with thisform.G2antt1
		with .Items
			.AddBar(Item,"Task",.CellValue(Item,2),.CellValue(Item,4))
		endwith
	endwith

with thisform.G2antt1
	.BeginUpdate
	.ColumnAutoResize = .F.
	rs = CreateObject("ADOR.Recordset")
	with rs
		.Open("Orders","Provider=Microsoft.ACE.OLEDB.12.0;Data Source=C:\Program Files\Exontrol\ExG2antt\Sample\Access\misc.accdb",3,3)
	endwith
	.DataSource = rs
	with .Chart
		.FirstVisibleDate = {^1994-8-4}
		.LevelCount = 2
		.PaneWidth(0) = 256
	endwith
	.Items.AllowCellValueToItemBar = .T.
	.Columns.Item(2).Def(18) = 1
	.Columns.Item(4).Def(18) = 2
	.EndUpdate
endwith
|
|
2067
|
ADODB, MDB
*** AddItem event - Occurs after a new Item has been inserted to Items collection. ***
LPARAMETERS Item
	with thisform.G2antt1
		with .Items
			.AddBar(Item,"Task",.CellValue(Item,2),.CellValue(Item,4))
		endwith
	endwith

with thisform.G2antt1
	.BeginUpdate
	.ColumnAutoResize = .F.
	rs = CreateObject("ADODB.Recordset")
	with rs
		.Open("Orders","Provider=Microsoft.ACE.OLEDB.12.0;Data Source=C:\Program Files\Exontrol\ExG2antt\Sample\Access\misc.accdb",3,3)
	endwith
	.DataSource = rs
	with .Chart
		.FirstVisibleDate = {^1994-8-4}
		.LevelCount = 2
		.PaneWidth(0) = 256
	endwith
	.Items.AllowCellValueToItemBar = .T.
	.Columns.Item(2).Def(18) = 1
	.Columns.Item(4).Def(18) = 2
	.EndUpdate
endwith
|
|
2066
|
ADOR, MDB
*** AddItem event - Occurs after a new Item has been inserted to Items collection. ***
LPARAMETERS Item
	with thisform.G2antt1
		with .Items
			.AddBar(Item,"Task",.CellValue(Item,2),.CellValue(Item,4))
		endwith
	endwith

with thisform.G2antt1
	.BeginUpdate
	.ColumnAutoResize = .F.
	rs = CreateObject("ADOR.Recordset")
	with rs
		.Open("Orders","Provider=Microsoft.ACE.OLEDB.12.0;Data Source=C:\Program Files\Exontrol\ExG2antt\Sample\Access\misc.accdb",3,3)
	endwith
	.DataSource = rs
	with .Chart
		.FirstVisibleDate = {^1994-8-4}
		.LevelCount = 2
		.PaneWidth(0) = 256
	endwith
	.Items.AllowCellValueToItemBar = .T.
	.Columns.Item(2).Def(18) = 1
	.Columns.Item(4).Def(18) = 2
	.EndUpdate
endwith
|
|
2065
|
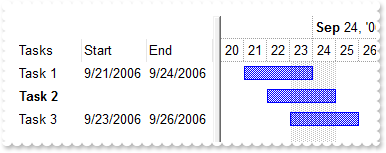
I am using exCellValueToItemBarProperty, Is it possible to �disable� this synchronisation for one (or several) item (sample-2)
with thisform.G2antt1
	.BeginUpdate
	with .Columns
		.Add("Tasks")
		.Add("Start").Def(18) = 1
		.Add("End").Def(18) = 2
	endwith
	with .Chart
		.FirstVisibleDate = {^2006-9-20}
		.LevelCount = 2
		.PaneWidth(0) = 196
		.AllowCreateBar = 1
	endwith
	with .Items
		.AllowCellValueToItemBar = .T.
		.AddBar(.AddItem("Task 1"),"Task",{^2006-9-21},{^2006-9-24})
		h = .AddItem("Task 2")
		.AddBar(h,"Task",{^2006-9-22},{^2006-9-25})
		.DefaultItem = h
		.ItemBold(0) = .T.
		.CellValueToItemBar(h,1,1,"newbar")
		.CellValueToItemBar(h,2,2,"newbar")
		.AddBar(.AddItem("Task 3"),"Task",{^2006-9-23},{^2006-9-26})
	endwith
	.EndUpdate
endwith
|
|
2064
|
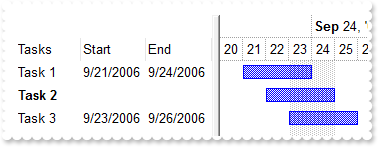
I am using exCellValueToItemBarProperty, Is it possible to �disable� this synchronisation for one (or several) item (sample-1)
with thisform.G2antt1
	.BeginUpdate
	with .Columns
		.Add("Tasks")
		.Add("Start").Def(18) = 1
		.Add("End").Def(18) = 2
	endwith
	with .Chart
		.FirstVisibleDate = {^2006-9-20}
		.LevelCount = 2
		.PaneWidth(0) = 196
	endwith
	with .Items
		.AllowCellValueToItemBar = .T.
		.AddBar(.AddItem("Task 1"),"Task",{^2006-9-21},{^2006-9-24})
		h = .AddItem("Task 2")
		.AddBar(h,"Task",{^2006-9-22},{^2006-9-25})
		.DefaultItem = h
		.FormatCell(0,1) = "``"
		.DefaultItem = h
		.FormatCell(0,2) = "``"
		.DefaultItem = h
		.ItemBold(0) = .T.
		.AddBar(.AddItem("Task 3"),"Task",{^2006-9-23},{^2006-9-26})
	endwith
	.EndUpdate
endwith
|
|
2063
|
How can I use the CRD (eXCRD format)
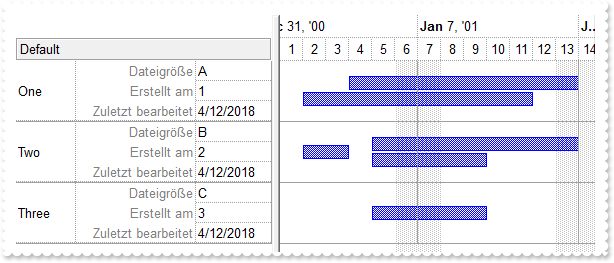
with thisform.G2antt1
.BeginUpdate
.HeaderAppearance = 4
.SelBackMode = 1
with .Columns.Add("Default")
var_s = "[b=0]60;1[b=15]:60,((20;"+chr(34)+"<fgcolor=808080>Dateigr��e"+chr(34)+"[b=1][a=2]:120,2[b=15])/(20;"+chr(34)+"<fgcolor=808080>Erstellt am"+chr(34)+"[a=2]:120,3[b=15])/"
var_s = var_s + "(20;"+chr(34)+"<fgcolor=808080>Zuletzt bearbeitet"+chr(34)+"[b=4][a=2]:120,4[b=15]))"
.Def(32) = var_s
.AllowSort = .F.
endwith
.Columns.Add(1).Visible = .F.
with .Columns.Add(2)
.Visible = .F.
.Editor.EditType = 1
.FormatColumn = "1 index `A-Z`"
endwith
with .Columns.Add(3)
.Visible = .F.
.Editor.EditType = 1
.FormatColumn = "1 index ``"
endwith
with .Columns.Add(4)
.Visible = .F.
.Editor.EditType = 1
.FormatColumn = "date(``)"
endwith
dih = 48
.DefaultItemHeight = dih
.DrawGridLines = -2
.GridLineStyle = 48
with .Chart
.DrawGridLines = -2
.GridLineStyle = 48
.PaneWidth(0) = 256
.LevelCount = 2
.FirstVisibleDate = {^2001-1-1}
.Bars.Item("Task").OverlaidType = 515 && OverlaidBarsTypeEnum.exOverlaidBarsStackAutoArrange Or OverlaidBarsTypeEnum.exOverlaidBarsStack
endwith
with .Items
h = .AddItem("")
.DefaultItem = h
.CellValue(0,1) = "One"
.AddBar(h,"Task",{^2001-1-2},{^2001-1-12},"A")
.AddBar(h,"Task",{^2001-1-4},{^2001-1-14},"B")
.DefaultItem = h
.ItemMaxHeight(0) = dih
h = .AddItem("")
.DefaultItem = h
.CellValue(0,1) = "Two"
.AddBar(h,"Task",{^2001-1-5},{^2001-1-10},"A")
.AddBar(h,"Task",{^2001-1-2},{^2001-1-4},"B")
.AddBar(h,"Task",{^2001-1-5},{^2001-1-14},"B2")
.DefaultItem = h
.ItemMaxHeight(0) = dih
h = .AddItem("")
.DefaultItem = h
.CellValue(0,1) = "Three"
.AddBar(h,"Task",{^2001-1-5},{^2001-1-10},"A")
endwith
.EndUpdate
endwith
|
|
2062
|
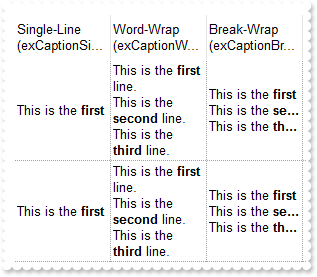
Type of wraps the cell's caption support (Sample 2)
with thisform.G2antt1
	.BeginUpdate
	.HeaderSingleLine = .F.
	.HeaderHeight = 36
	.DrawGridLines = -2
	.ColumnAutoResize = .F.
	.ScrollBySingleLine = .T.
	with .Columns
		with .Add("Single-Line (exCaptionSingleLine)")
			.Width = 96
			.Def(17) = 1
			.Def(16) = -1
			.Def(6) = 0
		endwith
		with .Add("Word-Wrap (exCaptionWordWrap)")
			.Width = 96
			.Def(17) = 1
			.Def(16) = 0
			.Def(6) = 0
			.FormatColumn = "%0"
		endwith
		with .Add("Break-Wrap (exCaptionBreakWrap)")
			.Width = 96
			.Def(17) = 1
			.Def(16) = 1
			.Def(6) = 0
			.FormatColumn = "%0"
		endwith
	endwith
	with .Items
		.AddItem("This is the <b>first</b> line.<br>This is the <b>second</b> line.<br>This is the <b>third</b> line.")
		.AddItem("This is the <b>first</b> line.\r\nThis is the <b>second</b> line.\r\nThis is the <b>third</b> line.")
	endwith
	.EndUpdate
endwith
|
|
2061
|
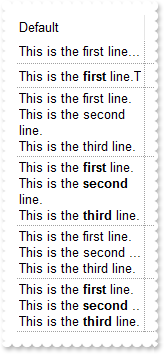
Type of wraps the cell's caption support (Sample 1)
with thisform.G2antt1
	.BeginUpdate
	.HeaderSingleLine = .F.
	.HeaderHeight = 36
	.DrawGridLines = -2
	.ColumnAutoResize = .F.
	.ScrollBySingleLine = .T.
	.Columns.Add("Default").Width = 128
	with .Items
		h = .AddItem("This is the first line.\r\nThis is the second line.\r\nThis is the third line.")
		h = .AddItem("This is the <b>first</b> line.<br>This is the <b>second</b> line.<br>This is the <b>third</b> line.")
		.DefaultItem = h
		.CellValueFormat(0,0) = 1
		h = .AddItem("This is the first line.\r\nThis is the second line.\r\nThis is the third line.")
		.DefaultItem = h
		.CellSingleLine(0,0) = 0
		h = .AddItem("This is the <b>first</b> line.<br>This is the <b>second</b> line.<br>This is the <b>third</b> line.")
		.DefaultItem = h
		.CellValueFormat(0,0) = 1
		.DefaultItem = h
		.CellSingleLine(0,0) = 0
		h = .AddItem("This is the first line.\r\nThis is the second line.\r\nThis is the third line.")
		.DefaultItem = h
		.CellSingleLine(0,0) = 1
		h = .AddItem("This is the <b>first</b> line.<br>This is the <b>second</b> line.<br>This is the <b>third</b> line.")
		.DefaultItem = h
		.CellValueFormat(0,0) = 1
		.DefaultItem = h
		.CellSingleLine(0,0) = 1
	endwith
	.EndUpdate
endwith
|
|
2060
|
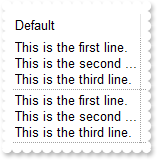
Can I break the cell's caption using the line break <br> or \r\n (Sample 2)
with thisform.G2antt1
	.BeginUpdate
	.DrawGridLines = -2
	.ColumnAutoResize = .F.
	.ScrollBySingleLine = .T.
	.Columns.Add("Default").Width = 128
	with .Items
		.DefaultItem = .AddItem("This is the first line.\r\nThis is the second line.\r\nThis is the third line.")
		.CellSingleLine(0,0) = 1
		.AddItem("This is the first line.\r\nThis is the second line.\r\nThis is the third line.")
	endwith
	.EndUpdate
endwith
|
|
2059
|
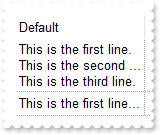
Can I break the cell's caption using the line break <br> or \r\n (Sample 1)
with thisform.G2antt1
	.BeginUpdate
	.DrawGridLines = -2
	.ColumnAutoResize = .F.
	.ScrollBySingleLine = .T.
	with .Columns.Add("Default")
		.Width = 128
		.Def(16) = 1
	endwith
	with .Items
		.AddItem("This is the first line.\r\nThis is the second line.\r\nThis is the third line.")
		.AddItem("This is the first line.\r\nThis is the second line.\r\nThis is the third line.")
	endwith
	.EndUpdate
endwith
|
|
2058
|
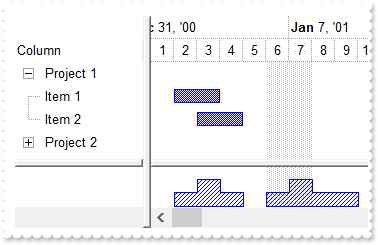
The histogram is showing empty space, when expanding an item. What could be wrong
with thisform.G2antt1
	.BeginUpdate
	.LinesAtRoot = 5
	with .Chart
		.LevelCount = 2
		.PaneWidth(0) = 128
		.FirstVisibleDate = {^2001-1-1}
		.HistogramVisible = .T.
		.HistogramHeight = 48
		.HistogramView = 1392 && HistogramViewEnum.exHistogramNoGrouping Or HistogramViewEnum.exHistogramLeafItems Or HistogramViewEnum.exHistogramAllItems
		.Bars.Item("Task").HistogramPattern = 6
	endwith
	.Columns.Add("Column")
	with .Items
		h = .AddItem("Project 1")
		.AddBar(.InsertItem(h,Null,"Item 1"),"Task",{^2001-1-2},{^2001-1-4})
		.AddBar(.InsertItem(h,Null,"Item 2"),"Task",{^2001-1-3},{^2001-1-5})
		.DefaultItem = h
		.ExpandItem(0) = .T.
		h = .AddItem("Project 2")
		.AddBar(.InsertItem(h,Null,"Item 1"),"Task",{^2001-1-7},{^2001-1-10})
		.AddBar(.InsertItem(h,Null,"Item 2"),"Task",{^2001-1-6},{^2001-1-8})
	endwith
	.EndUpdate
endwith
|
|
2057
|
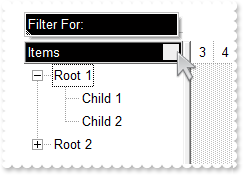
How can I change the visual appearance/color of the Filter For ... field
with thisform.G2antt1
	.BeginUpdate
	.LinesAtRoot = -1
	.BackColorHeader = RGB(1,0,0)
	.ForeColorHeader = RGB(255,255,255)
	.Object.Background(26) = .BackColorHeader
	.Object.Background(27) = .ForeColorHeader
	.Object.Background(0) = RGB(240,240,240)
	.Object.Background(32) = -1
	.HeaderAppearance = 5
	with .Columns.Add("Items")
		.FilterOnType = .T.
		.DisplayFilterButton = .T.
		.FilterList = 2
	endwith
	with .Items
		h = .AddItem("Root 1")
		.InsertItem(h,Null,"Child 1")
		.InsertItem(h,Null,"Child 2")
		.DefaultItem = h
		.ExpandItem(0) = .T.
		h = .AddItem("Root 2")
		.InsertItem(h,Null,"Child 1")
		.InsertItem(h,Null,"Child 2")
	endwith
	.EndUpdate
endwith
|
|
2056
|
How can I display the cell's caption without spaces on both sides
with thisform.G2antt1
	.BeginUpdate
	.ColumnAutoResize = .T.
	with .Columns.Add("Default")
		.Def(17) = 1
		.FormatColumn = "((trim(value) replace `   ` with ` `) replace `  ` with ` `) replace ` ` with `<bgcolor=FF0000> </bgcolor>`"
	endwith
	with .Items
		.AddItem("")
		.AddItem("Item A")
		.AddItem("    Item B")
		.AddItem("        Item   C    ")
	endwith
	.EndUpdate
endwith
|
|
2055
|
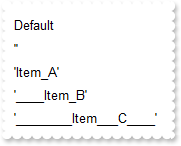
How can I highlight the spaces within the column (sample 2)
with thisform.G2antt1
	.BeginUpdate
	.ColumnAutoResize = .T.
	with .Columns.Add("Default")
		.Def(17) = 1
		.FormatColumn = "`'` + ( value replace ` ` with `_` ) + `'`"
	endwith
	with .Items
		.AddItem("")
		.AddItem("Item A")
		.AddItem("    Item B")
		.AddItem("        Item   C    ")
	endwith
	.EndUpdate
endwith
|
|
2054
|
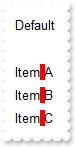
How can I highlight the spaces within the column (sample 1)
with thisform.G2antt1
	.BeginUpdate
	.ColumnAutoResize = .T.
	with .Columns.Add("Default")
		.Def(17) = 1
		.FormatColumn = "len(value) = 0 ? `<bgcolor=FF0000> </bgcolor>` : ( value replace ` ` with `<bgcolor=FF0000> </bgcolor>` )"
	endwith
	with .Items
		.AddItem("")
		.AddItem("Item A")
		.AddItem("    Item B")
		.AddItem("        Item   C    ")
	endwith
	.EndUpdate
endwith
|
|
2053
|
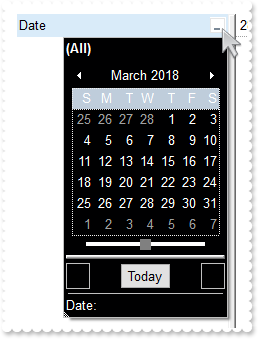
How can I change the visual aspect of the drop down filter-calendar
with thisform.G2antt1
	.BeginUpdate
	.Object.Background(26) = RGB(0,0,1)
	.Object.Background(27) = RGB(255,255,255)
	.Object.Background(12) = RGB(255,255,255)
	.Object.Background(8) = .Background(26)
	.Object.Background(11) = RGB(128,128,128)
	with .Columns.Add("Date")
		.FilterType = 4
		.DisplayFilterButton = .T.
		.DisplayFilterDate = .T.
		.DisplayFilterPattern = .F.
	endwith
	.EndUpdate
endwith
|
|
2052
|
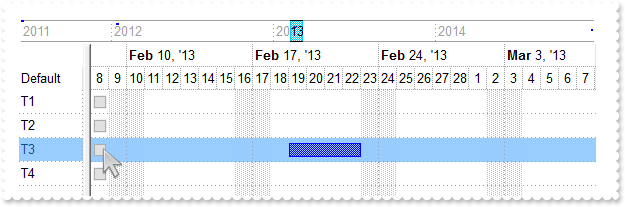
How can I scroll the chart to ensure that a bar fits the chart's client area
*** ButtonClick event - Occurs when user clicks on the cell's button. ***
LPARAMETERS Item, ColIndex, Key
	with thisform.G2antt1
		kBar = .Items.FirstItemBar(Item)
		dStart = .Items.ItemBar(Item,kBar,1)
		dEnd = .Items.ItemBar(Item,kBar,2)
		dScroll = .FormatABC("(A+B)/2",dStart,dEnd)
		.Chart.ScrollTo(dScroll,1)
	endwith

with thisform.G2antt1
	.BeginUpdate
	.ShowFocusRect = .F.
	.DrawGridLines = -1
	.GridLineStyle = 3
	.SelBackMode = 1
	with .Chart
		.OverviewVisible = 6402 && OverviewVisibleEnum.exOverviewShowDateTimeScaleBottom Or OverviewVisibleEnum.exOverviewAllowVerticalScroll Or OverviewVisibleEnum.exOverviewShowAllVisible
		.OverviewHeight = 26
		.FirstVisibleDate = {^2011-6-8}
		.AdjustLevelsToBase = .T.
		.PaneWidth(0) = 64
		.UnitWidth = 14
		.LevelCount = 2
		.DrawGridLines = -1
		.GridLineStyle = 3
		.SelBackColor = thisform.G2antt1.SelBackColor
		.ColumnsFormatLevel = ""+chr(34)+""+chr(34)+":2,("+chr(34)+""+chr(34)+"/14;1/"+chr(34)+""+chr(34)+"):14"
	endwith
	with .Columns
		.Add("Default")
		with .Add("")
			.Def(2) = .T.
			.Def(4) = 15790320
			.Visible = .F.
		endwith
	endwith
	with .Items
		.AddBar(.AddItem("T1"),"Task",{^2011-6-9},{^2011-6-17})
		.AddBar(.AddItem("T2"),"Task",{^2012-1-10},{^2012-1-17})
		.AddBar(.AddItem("T3"),"Task",{^2013-2-19},{^2013-2-23})
		.AddBar(.AddItem("T4"),"Task",{^2014-12-19},{^2014-12-23})
	endwith
	.EndUpdate
endwith
|
|
2051
|
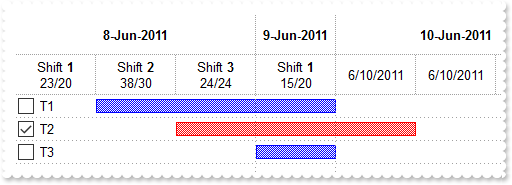
Is it possible to hide completely the list portion
with thisform.G2antt1
	.BeginUpdate
	.HeaderHeight = 32
	.OnResizeControl = 129 && OnResizeControlEnum.exDisableSplitter Or OnResizeControlEnum.exResizeChart
	.DrawGridLines = -1
	with .ConditionalFormats.Add("%CS0 = 1")
		.ApplyToBars = "Task"
		.BarColor = RGB(255,0,0)
	endwith
	with .Chart
		.FirstVisibleDate = {^2011-6-8}
		.AdjustLevelsToBase = .T.
		.PaneWidth(0) = 0
		.LevelCount = 2
		.AllowInsideZoom = .T.
		with .Level(0)
			.Alignment = 1
			.Label = "<b><%d%>-<%mmm%>-<%yyyy%>"
			.Unit = 4096
		endwith
		with .Level(1)
			.Label = "<%h%>"
			.Count = 8
			.Unit = 65536
			var_s = "date(int(dvalue)) case (#06/08/2011# : (int(value) case ( 0 : 'Shift <b>1</b><br>23/20'; 8 : 'Shift <b>2</b><br>38/30' ; 16 : 'S"
			var_s = var_s + "hift <b>3</b><br>24/24' ) ) ; #06/09/2011# : (int(value) case ( 0 : 'Shift <b>1</b><br>15/20'; 8 : 'Shift <b>2</b><br>30/32' ; 1"
			var_s = var_s + "6 : 'Shift <b>3</b><br>26/24' ) ) )"
			.FormatLabel = var_s
		endwith
		.UnitWidth = 64
		.NonworkingDays = 0
		.ColumnsFormatLevel = "0"
		.AllowInsideZoom = .T.
		.DefaultInsideZoomFormat.InsideUnit = 1048576
		.AllowResizeInsideZoom = .F.
		.InsideZoomOnDblClick = .F.
		with .InsideZooms
			.SplitBaseLevel = .F.
			.DefaultWidth = 0
		endwith
		with .InsideZooms
			.Add({^2011-6-9 8:00:00})
			.Add({^2011-6-9 16:00:00})
		endwith
		.DrawGridLines = -1
		.GridLineStyle = 3
	endwith
	.Columns.Add("Defaul").Def(0) = .T.
	with .Items
		.AddBar(.AddItem("T1"),"Task",{^2011-6-8 8:00:00},{^2011-6-10})
		.AddBar(.AddItem("T2"),"Task",{^2011-6-8 16:00:00},{^2011-6-10 8:00:00})
		.AddBar(.AddItem("T3"),"Task",{^2011-6-9},{^2011-6-10})
		.DefaultItem = .ItemByIndex(1)
		.CellState(0,0) = 1
	endwith
	.EndUpdate
endwith
|
|
2050
|
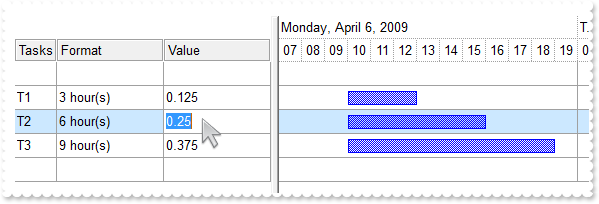
How can I find out what exBarWorkingCount represents
with thisform.G2antt1
	.BeginUpdate
	with .Columns.Add("Tasks")
		.AllowSizing = .F.
		.Width = 42
	endwith
	with .Columns.Add("Format")
		.Def(18) = 258
		var_s = "trim((1:=int((0:=value)/365) ? =:1 + ` year(s) ` : ``)  + (1:=int((0:=(=:0 - (=:1*365)))/31) ? =:1 + ` month(s) ` : ``) + (1:=in"
		var_s = var_s + "t((0:=(=:0 - (=:1*31)))/7) ? =:1 + ` week(s) ` : ``) + (1:=int((0:=(=:0 - (=:1*7)))/1) ? =:1 + ` day(s) ` : ``) + (1:=int((0:=(="
		var_s = var_s + ":0 - =:1 + 1/24/60/60/2))*24) ? =:1 + ` hour(s) ` : ``) + (1:=int((0:=(=:0*24 - =:1))*60) ? =:1 + ` min(s) ` : ``) + (1:=int((0:"
		var_s = var_s + "=(=:0*60 - =:1))*60) ? =:1 + ` sec(s)` : ``))"
		.FormatColumn = var_s
	endwith
	with .Columns.Add("Value")
		.Def(18) = 258
		.SortType = 1
		.Editor.EditType = 1
	endwith
	.HeaderAppearance = 4
	.DrawGridLines = -2
	.GridLineStyle = 48
	.SelBackColor = RGB(204,232,255)
	.SelForeColor = RGB(0,0,0)
	with .Chart
		.SelBackColor = thisform.G2antt1.SelBackColor
		.FirstVisibleDate = {^2009-4-6}
		.PaneWidth(0) = 256
		.LevelCount = 2
		.UnitScale = 65536
		.NonworkingHours = 15728767
		.ShowNonworkingDates = .F.
		.ShowNonworkingUnits = .F.
		.ShowNonworkingHours = .F.
		with .Bars.Item("Task")
			.Def(20) = .T.
		endwith
		.AllowLinkBars = .F.
		.DrawGridLines = -2
		.GridLineStyle = 48
		.Level(0).DrawGridLines = .T.
		.ResizeUnitScale = 1048576
		.ResizeUnitCount = 15
		var_s1 = "<|><%nn%><|><%h%>:<%nn%> <%AM/PM%><|><%d3%>, <%m3%> <%d%>, '<%yy%> <%h%>:<%nn%> <%AM/PM%><|><%dddd%>, <%mmmm%> <%d%>, <%yyyy%> <"
		var_s1 = var_s1 + "%h%>:<%nn%> <%AM/PM%><||>15"
		.Label(1048576) = var_s1
		.AllowZoomOnFly = 280 && ZoomOnFlyEnum.exZoomOnFlyIncludeNeighborItems Or ZoomOnFlyEnum.exZoomOnFly
		.BackColorZoomOnFly = RGB(255,255,0)
	endwith
	.Items.AllowCellValueToItemBar = .T.
	with .Items
		h = .AddItem("")
		.DefaultItem = h
		.SelectableItem(0) = .F.
		.DefaultItem = h
		.SortableItem(0) = .F.
		.AddBar(.AddItem("T1"),"Task",{^2009-4-6 10:00:00},{^2009-4-6 13:00:00})
		.AddBar(.AddItem("T2"),"Task",{^2009-4-6 10:00:00},{^2009-4-6 16:00:00})
		.AddBar(.AddItem("T3"),"Task",{^2009-4-6 10:00:00},{^2009-4-6 19:00:00})
		h = .AddItem("")
		.DefaultItem = h
		.SelectableItem(0) = .F.
		.DefaultItem = h
		.SortableItem(0) = .F.
	endwith
	.EndUpdate
endwith
|
|
2049
|
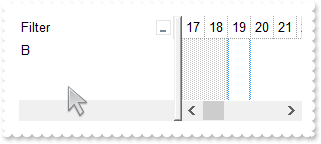
How can I hide the filter bar description
with thisform.G2antt1
	.BeginUpdate
	with .Columns.Add("Filter")
		.DisplayFilterButton = .T.
		.FilterType = 240
		.Filter = "B"
	endwith
	with .Items
		.AddItem("A")
		.AddItem("B")
		.AddItem("C")
	endwith
	.ApplyFilter
	.FilterBarHeight = 0
	.EndUpdate
endwith
|
|
2048
|
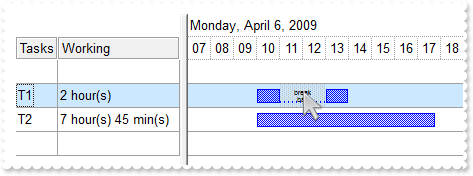
How can I add a break bar
with thisform.G2antt1
	.BeginUpdate
	with .Columns.Add("Tasks")
		.AllowSizing = .F.
		.Width = 42
	endwith
	with .Columns.Add("Working")
		.Def(18) = 258
		var_s = "((1:=int(0:= (value))) != 0 ? (=:1 + ' day(s)') : '') + (=:1 ? ' ' : '' ) + ((1:=int(0:=((=:0 - =:1 + 1/24/60/60/2)*24))) != 0 ?"
		var_s = var_s + " =:1 + ' hour(s)' : '' ) + (=:1 ? ' ' : '' ) + ((1:=round((=:0 - =:1)*60)) != 0 ? =:1 + ' min(s)' : '')"
		.FormatColumn = var_s
	endwith
	.HeaderAppearance = 4
	.DrawGridLines = -2
	.GridLineStyle = 48
	.SelBackColor = RGB(204,232,255)
	.SelForeColor = RGB(0,0,0)
	with .Chart
		.SelBackColor = thisform.G2antt1.SelBackColor
		.FirstVisibleDate = {^2009-4-6}
		.PaneWidth(0) = 164
		.LevelCount = 2
		.UnitScale = 65536
		.NonworkingHours = 15728767
		.ShowNonworkingDates = .F.
		.ShowNonworkingUnits = .F.
		.ShowNonworkingHours = .F.
		with .Bars.Add("Task:Split")
			.Def(20) = .T.
			.Shortcut = "Task"
		endwith
		.AllowLinkBars = .F.
		.DrawGridLines = -2
		.GridLineStyle = 48
		.Level(0).DrawGridLines = .T.
		.ResizeUnitScale = 1048576
		.ResizeUnitCount = 15
		var_s1 = "<|><%nn%><|><%h%>:<%nn%> <%AM/PM%><|><%d3%>, <%m3%> <%d%>, '<%yy%> <%h%>:<%nn%> <%AM/PM%><|><%dddd%>, <%mmmm%> <%d%>, <%yyyy%> <"
		var_s1 = var_s1 + "%h%>:<%nn%> <%AM/PM%><||>15"
		.Label(1048576) = var_s1
		.AllowZoomOnFly = 280 && ZoomOnFlyEnum.exZoomOnFlyIncludeNeighborItems Or ZoomOnFlyEnum.exZoomOnFly
		.BackColorZoomOnFly = RGB(255,255,0)
		.AllowNonworkingBars = .T.
	endwith
	.Items.AllowCellValueToItemBar = .T.
	with .Items
		.AddItem("")
		h = .AddItem("T1")
		.DefaultItem = h
		.ItemNonworkingUnits(0,.F.) = "(weekday(value) in (0,6)) or (timeF(value) < `07:00:00`) or (timeF(value) >= `20:00:00`) "
		.AddBar(h,"",{^2009-4-6 7:30:00},{^2009-4-6 9:30:00},"A","<c><font ;4>break<br>bar")
		.DefaultItem = h
		.ItemBar(0,"A",38) = .T.
		.AddBar(h,"Task",{^2009-4-6 10:00:00},{^2009-4-6 12:00:00})
		.AddBar(.AddItem("T2"),"Task",{^2009-4-6 10:00:00},{^2009-4-6 17:45:00})
		.AddItem("")
	endwith
	.EndUpdate
endwith
|
|
2047
|
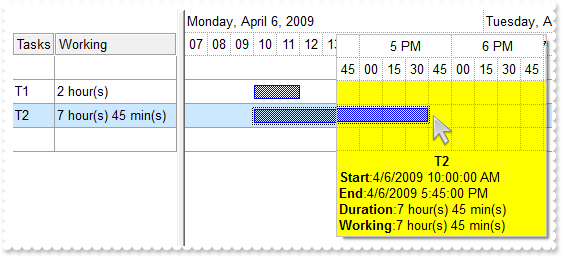
It seems the ResizeUnitCount have no effect on the ZoomOnFly feature, is it normal
with thisform.G2antt1
	.BeginUpdate
	with .Columns.Add("Tasks")
		.AllowSizing = .F.
		.Width = 42
	endwith
	with .Columns.Add("Working")
		.Def(18) = 258
		var_s = "((1:=int(0:= (value))) != 0 ? (=:1 + ' day(s)') : '') + (=:1 ? ' ' : '' ) + ((1:=int(0:=((=:0 - =:1 + 1/24/60/60/2)*24))) != 0 ?"
		var_s = var_s + " =:1 + ' hour(s)' : '' ) + (=:1 ? ' ' : '' ) + ((1:=round((=:0 - =:1)*60)) != 0 ? =:1 + ' min(s)' : '')"
		.FormatColumn = var_s
	endwith
	.HeaderAppearance = 4
	.DrawGridLines = -2
	.GridLineStyle = 48
	.SelBackColor = RGB(204,232,255)
	.SelForeColor = RGB(0,0,0)
	with .Chart
		.SelBackColor = thisform.G2antt1.SelBackColor
		.FirstVisibleDate = {^2009-4-6}
		.PaneWidth(0) = 164
		.LevelCount = 2
		.UnitScale = 65536
		.NonworkingHours = 15728767
		.ShowNonworkingDates = .F.
		.ShowNonworkingUnits = .F.
		.ShowNonworkingHours = .F.
		with .Bars.Item("Task")
			.Def(20) = .T.
		endwith
		.AllowLinkBars = .F.
		.DrawGridLines = -2
		.GridLineStyle = 48
		.Level(0).DrawGridLines = .T.
		.ResizeUnitScale = 1048576
		.ResizeUnitCount = 15
		var_s1 = "<|><%nn%><|><%h%>:<%nn%> <%AM/PM%><|><%d3%>, <%m3%> <%d%>, '<%yy%> <%h%>:<%nn%> <%AM/PM%><|><%dddd%>, <%mmmm%> <%d%>, <%yyyy%> <"
		var_s1 = var_s1 + "%h%>:<%nn%> <%AM/PM%><||>15"
		.Label(1048576) = var_s1
		.AllowZoomOnFly = 280 && ZoomOnFlyEnum.exZoomOnFlyIncludeNeighborItems Or ZoomOnFlyEnum.exZoomOnFly
		.BackColorZoomOnFly = RGB(255,255,0)
	endwith
	.Items.AllowCellValueToItemBar = .T.
	with .Items
		.AddItem("")
		.AddBar(.AddItem("T1"),"Task",{^2009-4-6 10:00:00},{^2009-4-6 12:00:00})
		.AddBar(.AddItem("T2"),"Task",{^2009-4-6 10:00:00},{^2009-4-6 17:45:00})
		.AddItem("")
	endwith
	.EndUpdate
endwith
|
|
2046
|
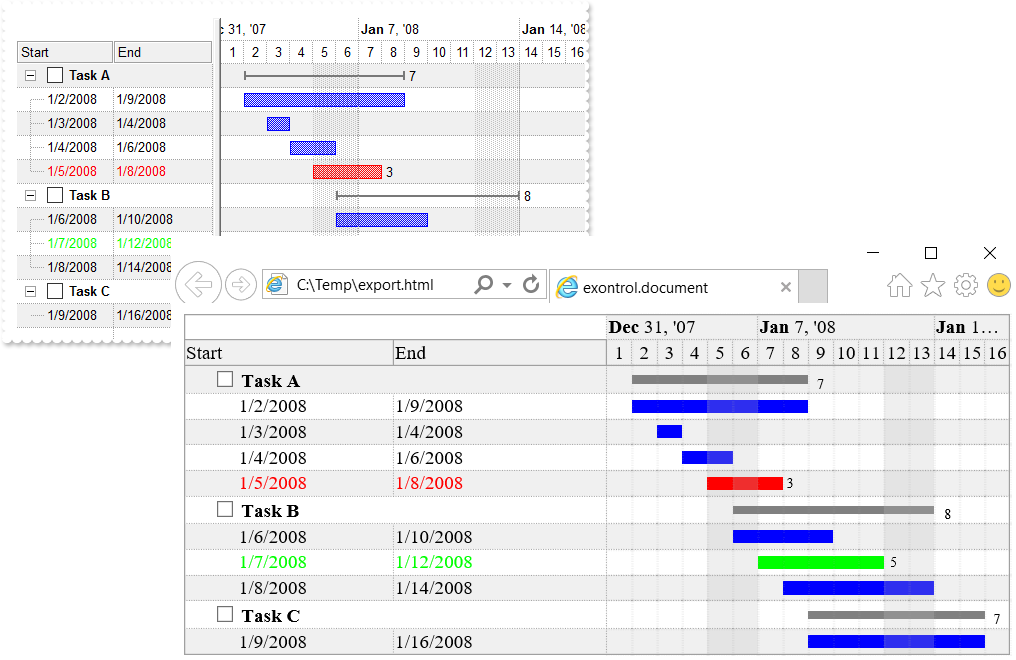
Export Data in HTML format
*** AddGroupItem event - Occurs after a new Group Item has been inserted to Items collection. ***
LPARAMETERS Item
	with thisform.G2antt1
		with .Items
			.DefaultItem = Item
			.ItemBold(0) = .T.
			.AddBar(Item,"Summary",.CellValue(Item,2),.CellValue(Item,4))
			.DefineSummaryBars(Item,"",-3,"")
		endwith
	endwith

*** AddItem event - Occurs after a new Item has been inserted to Items collection. ***
LPARAMETERS Item
	with thisform.G2antt1
		with .Items
			i = .ItemToIndex(Item)
			.AddBar(Item,"Task",{^2008-1-2},{^2008-1-9},"")
			.DefaultItem = Item
			.ItemBar(0,"",514) = i
			.DefaultItem = Item
			.ItemBar(0,"",513) = i
		endwith
	endwith

with thisform.G2antt1
	.BeginUpdate
	.BackColorAlternate = RGB(240,240,240)
	.DrawGridLines = -1
	.HeaderAppearance = 4
	.Object.Description(11) = .FormatABC("`<fgcolor=808080> ` + value + ` </fgcolor>`",.Description(11))
	var_s = "(( ( value replace `[<b>` with `<bgcolor=000000><fgcolor=FFFFFF><b> ` replace `</b>]` with ` </b></bgcolor></fgcolor>` replace `"
	var_s = var_s + "[<s>` with `<bgcolor=C0C0C0><fgcolor=FFFFFF> ` replace `</s>]` with ` </fgcolor></bgcolor>` )  + `<r><fgcolor=808080>` + ( match"
	var_s = var_s + "itemcount < 0 ? ( ( len(value) ? `` : `` ) + `<r>` + abs(matchitemcount + 1) + ` result(s)` ) : (`<r><fgcolor=808080>`+ itemcoun"
	var_s = var_s + "t + ` item(s)`) )))"
	.FilterBarCaption = var_s
	.FilterBarPromptVisible = 2579 && FilterBarVisibleEnum.exFilterBarCompact Or FilterBarVisibleEnum.exFilterBarShowCloseIfRequired Or FilterBarVisibleEnum.exFilterBarSingleLine Or FilterBarVisibleEnum.exFilterBarVisible Or FilterBarVisibleEnum.exFilterBarPromptVisible
	.FilterBarPromptType = 2
	.SingleSort = .F.
	.AllowGroupBy = .T.
	.BackColorSortBar = .BackColor
	.DrawGridLines = -1
	with .VisualAppearance
		var_s1 = "gBFLBCJwBAEHhEJAAEhABOUGACAADACAxRDgMQBQKAAzAJBIYhiG4cYCgMZhXDOCYXABCEYRXBIZQ7BKNIxjSJwFgmEgADCMQwAFBIbhrE4ZBjHGQRUgyI43RhHUBzVI"
		var_s1 = var_s1 + "UBxDEaTZLlEYJBgeHYhDJPcaUVDcWQHGyeZwjSgpKoWSJIU5NcggPDgEwTKCmKlTAKoSzJMyEmwWRAdVTZLSEaxierKPhyWT/XgAF4PfDFKRXFqXY5mKZJFqKOI8TxIN"
		var_s1 = var_s1 + "gxPQMGyrBqraLqKwQGrGCQKSBhUZ3dS2JR3OSlYRuQAMVgOXoDZhPWZXbDtSzPE63NgtOR5DiGWalABoeoxRa9cz3ViCJSrGTqIoINIzZLHFQbPpdAYdP6BeIjXhhZxB"
		var_s1 = var_s1 + "BuLZXmEOh9CcNoni2N4MjWVodh+DpfBeLJinsWR9AyYwVAkGBhEAFphGiRogDEGBamkFgtjcZgHiMbgehYaQhAIEIREAaQYkcQZUHIGRUGQDBOEaBAhDYDxGkMZAkCge"
		var_s1 = var_s1 + "oagYZAYEYAYIAWGhemICIFj8WIiCiFR5gkIhogmBoKGKJx2C6C5hniMgggqYwog0UoNGMZJiDiCZRgOLY0ECUAQICA=="
		.Add(1,var_s1)
		.RenderType = -268435456
	endwith
	with .Chart
		.DrawGridLines = -1
		.PaneWidth(0) = 196
		.LevelCount = 2
		.FirstVisibleDate = {^2008-1-1}
		.FirstWeekDay = 1
		with .Bars.Item("Summary")
			.StartShape = 0
			.EndShape = 0
			.Shape = 1
			.Color = 0x1808080
			.Height = 7
			.Def(3) = "<%=%513%>"
			.Def(4) = 18
		endwith
		with .Bars.Item("Task")
			.Def(3) = "<%=(%2-%1) in (3,5) ? %513 : `` %>"
			.Def(4) = 18
		endwith
	endwith
	with .ConditionalFormats.Add("(%2 - %1) = 3","K3")
		.ForeColor = RGB(255,0,0)
		.BarColor = .ForeColor
		.ApplyToBars = "Task"
	endwith
	with .ConditionalFormats.Add("(%2 - %1) = 5","K5")
		.ForeColor = RGB(0,255,0)
		.BarColor = .ForeColor
		.ApplyToBars = "Task"
	endwith
	with .Columns
		.Add("Tasks").Def(0) = .T.
		with .Add("Start")
			.Def(18) = 1
			.Def(19) = ""
		endwith
		with .Add("End")
			.Def(18) = 2
			.Def(19) = ""
		endwith
	endwith
	with .Items
		.AllowCellValueToItemBar = .T.
		.AddItem("Task A")
		.AddItem("Task A")
		.AddItem("Task A")
		.AddItem("Task A")
		.AddItem("Task B")
		.AddItem("Task B")
		.AddItem("Task B")
		.AddItem("Task C")
	endwith
	.Columns.Item("Tasks").SortOrder = 1
	.EndUpdate
	sFile = "c:/temp/export.html"
	.Export(sFile,"vis")
	with CreateObject("InternetExplorer.Application")
		.Navigate2(sFile)
	endwith
endwith
|
|
2045
|
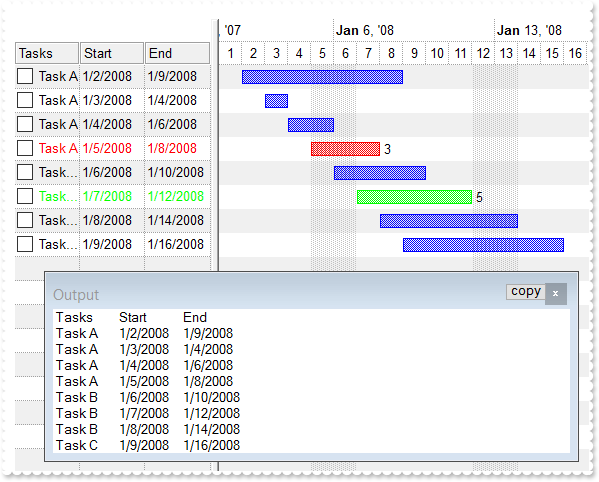
Export Data in CSV format
*** AddItem event - Occurs after a new Item has been inserted to Items collection. ***
LPARAMETERS Item
	with thisform.G2antt1
		with .Items
			i = .ItemToIndex(Item)
			.AddBar(Item,"Task",{^2008-1-2},{^2008-1-9},"")
			.DefaultItem = Item
			.ItemBar(0,"",514) = i
			.DefaultItem = Item
			.ItemBar(0,"",513) = i
		endwith
	endwith

with thisform.G2antt1
	.BeginUpdate
	.BackColorAlternate = RGB(240,240,240)
	.DrawGridLines = -1
	.HeaderAppearance = 4
	.Object.Description(11) = .FormatABC("`<fgcolor=808080> ` + value + ` </fgcolor>`",.Description(11))
	var_s = "(( ( value replace `[<b>` with `<bgcolor=000000><fgcolor=FFFFFF><b> ` replace `</b>]` with ` </b></bgcolor></fgcolor>` replace `"
	var_s = var_s + "[<s>` with `<bgcolor=C0C0C0><fgcolor=FFFFFF> ` replace `</s>]` with ` </fgcolor></bgcolor>` )  + `<r><fgcolor=808080>` + ( match"
	var_s = var_s + "itemcount < 0 ? ( ( len(value) ? `` : `` ) + `<r>` + abs(matchitemcount + 1) + ` result(s)` ) : (`<r><fgcolor=808080>`+ itemcoun"
	var_s = var_s + "t + ` item(s)`) )))"
	.FilterBarCaption = var_s
	.FilterBarPromptVisible = 2579 && FilterBarVisibleEnum.exFilterBarCompact Or FilterBarVisibleEnum.exFilterBarShowCloseIfRequired Or FilterBarVisibleEnum.exFilterBarSingleLine Or FilterBarVisibleEnum.exFilterBarVisible Or FilterBarVisibleEnum.exFilterBarPromptVisible
	.FilterBarPromptType = 2
	with .Chart
		.PaneWidth(0) = 196
		.LevelCount = 2
		.FirstVisibleDate = {^2008-1-1}
		with .Bars.Item("Task")
			.Def(3) = "<%=(%2-%1) in (3,5) ? %513 : `` %>"
			.Def(4) = 18
		endwith
	endwith
	with .ConditionalFormats.Add("(%2 - %1) = 3","K3")
		.ForeColor = RGB(255,0,0)
		.BarColor = .ForeColor
		.ApplyToBars = "Task"
	endwith
	with .ConditionalFormats.Add("(%2 - %1) = 5","K5")
		.ForeColor = RGB(0,255,0)
		.BarColor = .ForeColor
		.ApplyToBars = "Task"
	endwith
	with .Columns
		.Add("Tasks").Def(0) = .T.
		with .Add("Start")
			.Def(18) = 1
			.Def(19) = ""
		endwith
		with .Add("End")
			.Def(18) = 2
			.Def(19) = ""
		endwith
	endwith
	with .Items
		.AllowCellValueToItemBar = .T.
		.AddItem("Task A")
		.AddItem("Task A")
		.AddItem("Task A")
		.AddItem("Task A")
		.AddItem("Task B")
		.AddItem("Task B")
		.AddItem("Task B")
		.AddItem("Task C")
	endwith
	.EndUpdate
	DEBUGOUT( .Export("","vis") )
endwith
|
|
2044
|
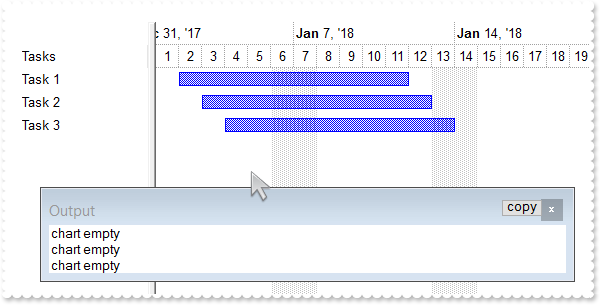
I want to be able to detect when a user clicks on a row in the chart that is not populated
*** MouseMove event - Occurs when the user moves the mouse. ***
LPARAMETERS Button, Shift, X, Y
	with thisform.G2antt1
		item = .ItemFromPoint(-1,-1,col,hit)
		date = .Chart.DateFromPoint(-1,-1)
		sMessage = .FormatABC("(not(A = 0) ? `chart` : `list`) + ` ` + (not(B = 0) ? `item` : `empty`)  ",date,item)
		DEBUGOUT( sMessage )
	endwith

with thisform.G2antt1
	.BeginUpdate
	with .Chart
		.PaneWidth(0) = 128
		.LevelCount = 2
		.FirstVisibleDate = {^2018-1-1}
	endwith
	.Columns.Add("Tasks")
	with .Items
		.AddBar(.AddItem("Task 1"),"Task",{^2018-1-2},{^2018-1-12})
		.AddBar(.AddItem("Task 2"),"Task",{^2018-1-3},{^2018-1-13})
		.AddBar(.AddItem("Task 3"),"Task",{^2018-1-4},{^2018-1-14})
	endwith
	.EndUpdate
endwith
|
|
2043
|
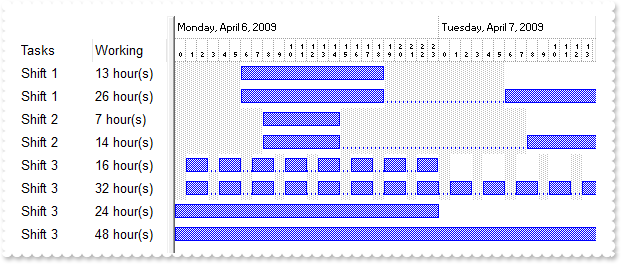
Is it possible to have multiple calendars. A calendar for each row for example. Reason : some of our lines work 2 shifts but some also have a night shift
with thisform.G2antt1
	.BeginUpdate
	.Columns.Add("Tasks")
	with .Columns.Add("Working")
		.Def(18) = 258
		var_s = "((1:=int(0:=( 24*int(value) + (value - int(value) + 1/24/60/60/2)*24))) != 0 ? =:1 + ' hour(s)' : '' ) + (=:1 ? ' ' : '' ) + ((1"
		var_s = var_s + ":=round((=:0 - =:1)*60)) != 0 ? =:1 + ' min(s)' : '')"
		.FormatColumn = var_s
	endwith
	with .Chart
		.FirstVisibleDate = {^2009-4-6}
		.PaneWidth(0) = 148
		.LevelCount = 2
		.ShowNonworkingUnits = .F.
		.ShowNonworkingDates = .F.
		with .Bars
			.Add("Task:Split").Shortcut = "Task"
			.Item("Task").Def(20) = .T.
		endwith
		.Label(65536) = "<%h%><||><||>65536"
		.Level(0).FormatLabel = "`<font small fonts;6>` + value"
		var_s1 = "len(value) = 2 ? (`<font small fonts;4>` + (value left 1) + `<br>` + (value right 1) ) : (`<font small fonts;4>` + ` <br>` + (va"
		var_s1 = var_s1 + "lue left 1) + `` )"
		.Level(1).FormatLabel = var_s1
		.UnitScale = 65536
		.UnitWidth = 9
	endwith
	.Items.AllowCellValueToItemBar = .T.
	with .Items
		sCalendar1 = "weekday(value) in (0,6) or (hour(value) < 6) or (hour(value) > 18)"
		h = .AddItem("Shift 1")
		.DefaultItem = h
		.ItemNonworkingUnits(0,.F.) = sCalendar1
		.AddBar(h,"Task",{^2009-4-6},{^2009-4-7})
		h = .AddItem("Shift 1")
		.DefaultItem = h
		.ItemNonworkingUnits(0,.F.) = sCalendar1
		.AddBar(h,"Task",{^2009-4-6},{^2009-4-8})
		sCalendar2 = "weekday(value) in (0,6) or (hour(value) < 8) or (hour(value) > 14)"
		h = .AddItem("Shift 2")
		.DefaultItem = h
		.ItemNonworkingUnits(0,.F.) = sCalendar2
		.AddBar(h,"Task",{^2009-4-6},{^2009-4-7})
		h = .AddItem("Shift 2")
		.DefaultItem = h
		.ItemNonworkingUnits(0,.F.) = sCalendar2
		.AddBar(h,"Task",{^2009-4-6},{^2009-4-8})
		sCalendar3 = "weekday(value) in (0,6) or 0 = ( hour(value) mod 3 ) "
		h = .AddItem("Shift 3")
		.DefaultItem = h
		.ItemNonworkingUnits(0,.F.) = sCalendar3
		.AddBar(h,"Task",{^2009-4-6},{^2009-4-7})
		h = .AddItem("Shift 3")
		.DefaultItem = h
		.ItemNonworkingUnits(0,.F.) = sCalendar3
		.AddBar(h,"Task",{^2009-4-6},{^2009-4-8})
		sCalendar4 = "weekday(value) in (0,6)"
		h = .AddItem("Shift 3")
		.DefaultItem = h
		.ItemNonworkingUnits(0,.F.) = sCalendar4
		.AddBar(h,"Task",{^2009-4-6},{^2009-4-7})
		h = .AddItem("Shift 3")
		.DefaultItem = h
		.ItemNonworkingUnits(0,.F.) = sCalendar4
		.AddBar(h,"Task",{^2009-4-6},{^2009-4-8})
	endwith
	.EndUpdate
endwith
|
|
2042
|
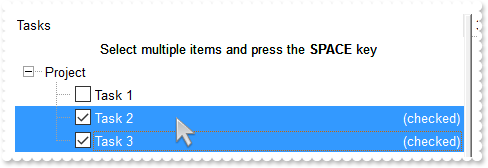
Is it possible to check multiple-items at once
*** AddItem event - Occurs after a new Item has been inserted to Items collection. ***
LPARAMETERS Item
	with thisform.G2antt1
		bHasParent = .FormatABC("value != 0",.Items.ItemParent(Item))
		with .Items
			.DefaultItem = Item
			.CellHasCheckBox(0,0) = bHasParent
		endwith
	endwith

with thisform.G2antt1
	.BeginUpdate
	.LinesAtRoot = -1
	with .Columns.Add("Tasks")
		.Def(17) = 1
		.FormatColumn = "value + (%CS0 = 1 ? `<r><fgcolor=808080>(checked)` : ``)"
	endwith
	.HeaderVisible = 1
	.SingleSel = .F.
	with .Items
		h = .AddItem("Project")
		hChild = .InsertItem(h,Null,"Task 1")
		hChild = .InsertItem(h,Null,"Task 2")
		hChild = .InsertItem(h,Null,"Task 3")
		.DefaultItem = h
		.ExpandItem(0) = .T.
		.LockedItemCount(0) = 1
		.DefaultItem = .LockedItem(0,0)
		.CellValue(0,0) = "<c>Select multiple items and press the <b>SPACE</b> key"
	endwith
	.EndUpdate
endwith
|
|
2041
|
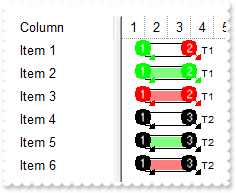
How can I prevent changing the start/end colors of the bar, when ItemBar(exBarColor) property is applied
with thisform.G2antt1
	.BeginUpdate
	var_s = "gBJJgBAIDAAGAAEAAQhYAf8Pf4hh0QihCJo2AEZjQAjEZFEaIEaEEaAIAkcbk0olUrlktl0vmExmUzmk1m03nE5nU7nk9n0/oFBoVDolFo1HpFJpVLplNp1PqFRqVTql"
	var_s = var_s + "Vq1XrFZrVbrldr1fsFhsVjslls1ntFptVrtltt1vuFxuVzul1u13vF5vV7vl9v1/wGBwWDwmFw2HxGJxWLxmNx0xiFdyOTh8Tf9ZymXx+QytcyNgz8r0OblWjyWds+m0"
	var_s = var_s + "ka1Vf1ta1+r1mos2xrG2xeZ0+a0W0qOx3GO4NV3WeyvD2XJ5XL5nN51aiw+lfSj0gkUkAEllHanHI5j/cHg8EZf7w8vl8j4f/qfEZeB09/vjLAB30+kZQAP/P5/H6/yN"
	var_s = var_s + "AOAEAwCjMBwFAEDwJBMDwLBYAP2/8Hv8/gAGAD8LQs9w/nhDY/oygIA="
	.Images(var_s)
	.VisualAppearance.Add(1,"E:\Exontrol\ExButton\sample\EBN\Assorted\bhframe.ebn")
	.Chart.PaneWidth(0) = 96
	with .Chart.Bars
		.AddShapeCorner(12345,1)
		.AddShapeCorner(999,2)
		.AddShapeCorner(1049,3)
		with .Add("T1")
			.StartShape = 12345 && 0x3020 Or ShapeCornerEnum.exShapeIconVBar Or ShapeCornerEnum.exShapeIconRight
			.EndShape = 999 && 0x3e0 Or ShapeCornerEnum.exShapeIconLeft
			.Pattern = 4
			.StartColor = RGB(0,255,0)
			.Color = 0x1000000
			.EndColor = RGB(255,0,0)
			.Def(3) = "<%=`<font ;6>  ` + %0 + ``%>"
			.Def(4) = 18
		endwith
		with .Add("T2")
			.StartShape = 12345 && 0x3020 Or ShapeCornerEnum.exShapeIconVBar Or ShapeCornerEnum.exShapeIconRight
			.EndShape = 1049 && 0x400 Or ShapeCornerEnum.exShapeIconVBar Or ShapeCornerEnum.exShapeIconRight
			.Pattern = 4
			.StartColor = -1
			.Color = 0x1000000
			.EndColor = -1
			.Def(3) = "<%=`<font ;6>  ` + %0 + ``%>"
			.Def(4) = 18
		endwith
	endwith
	.Chart.FirstVisibleDate = {^2001-1-1}
	.Columns.Add("Column")
	with .Items
		h = .AddItem("Item 1")
		.AddBar(h,"T1",{^2001-1-2},{^2001-1-4})
		h = .AddItem("Item 2")
		.AddBar(h,"T1",{^2001-1-2},{^2001-1-4})
		.DefaultItem = h
		.ItemBar(0,"",33) = 65280
		h = .AddItem("Item 3")
		.AddBar(h,"T1",{^2001-1-2},{^2001-1-4})
		.DefaultItem = h
		.ItemBar(0,"",33) = 255
		h = .AddItem("Item 4")
		.AddBar(h,"T2",{^2001-1-2},{^2001-1-4})
		h = .AddItem("Item 5")
		.AddBar(h,"T2",{^2001-1-2},{^2001-1-4})
		.DefaultItem = h
		.ItemBar(0,"",33) = 65280
		h = .AddItem("Item 6")
		.AddBar(h,"T2",{^2001-1-2},{^2001-1-4})
		.DefaultItem = h
		.ItemBar(0,"",33) = 255
	endwith
	.EndUpdate
endwith
|
|
2040
|
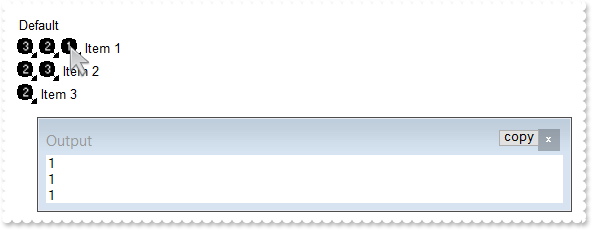
How can I get the icon from the cell when using the Items.CellImages property (icon index)
*** MouseMove event - Occurs when the user moves the mouse. ***
LPARAMETERS Button, Shift, X, Y
	with thisform.G2antt1
		i = .ItemFromPoint(-1,-1,c,hit)
		DEBUGOUT( .FormatABC("( 0x44 = ( value bitand 0x44 ) ) ? ( ( (value bitand 0xFFFF0000) bitshift 16 ) array B split `,` )  : `no image`",hit,.Items.CellImages(i,c)) )
	endwith

with thisform.G2antt1
	.BeginUpdate
	var_s = "gBJJgBAIDAAGAAEAAQhYAf8Pf4hh0QihCJo2AEZjQAjEZFEaIEaEEaAIAkcbk0olUrlktl0vmExmUzmk1m03nE5nU7nk9n0/oFBoVDolFo1HpFJpVLplNp1PqFRqVTql"
	var_s = var_s + "Vq1XrFZrVbrldr1fsFhsVjslls1ntFptVrtltt1vuFxuVzul1u13vF5vV7vl9v1/wGBwWDwmFw2HxGJxWLxmNx0xiFdyOTh8Tf9ZymXx+QytcyNgz8r0OblWjyWds+m0"
	var_s = var_s + "ka1Vf1ta1+r1mos2xrG2xeZ0+a0W0qOx3GO4NV3WeyvD2XJ5XL5nN51aiw+lfSj0gkUkAEllHanHI5j/cHg8EZf7w8vl8j4f/qfEZeB09/vjLAB30+kZQAP/P5/H6/yN"
	var_s = var_s + "AOAEAwCjMBwFAEDwJBMDwLBYAP2/8Hv8/gAGAD8LQs9w/nhDY/oygIA="
	.Images(var_s)
	.Chart.PaneWidth(1) = 0
	.Columns.Add("Default")
	with .Items
		.DefaultItem = .AddItem("Item 1")
		.CellImages(0,0) = "3,2,1"
		.DefaultItem = .AddItem("Item 2")
		.CellImages(0,0) = "2,3"
		.DefaultItem = .AddItem("Item 3")
		.CellImages(0,0) = "2,"
	endwith
	.EndUpdate
endwith
|
|
2039
|
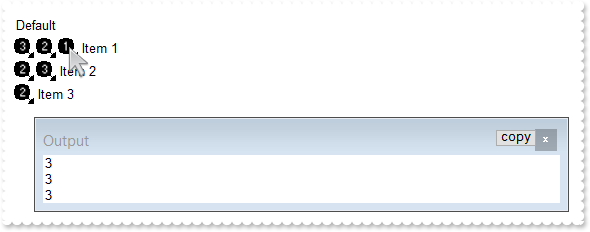
How can I get the icon from the cell when using the Items.CellImages property (icon position within the cell)
*** MouseMove event - Occurs when the user moves the mouse. ***
LPARAMETERS Button, Shift, X, Y
	with thisform.G2antt1
		i = .ItemFromPoint(-1,-1,c,hit)
		DEBUGOUT( .FormatABC("( 0x44 = ( value bitand 0x44 ) ) ? 1 + ( (value bitand 0xFFFF0000) bitshift 16 ) : `no image`",hit) )
	endwith

with thisform.G2antt1
	.BeginUpdate
	var_s = "gBJJgBAIDAAGAAEAAQhYAf8Pf4hh0QihCJo2AEZjQAjEZFEaIEaEEaAIAkcbk0olUrlktl0vmExmUzmk1m03nE5nU7nk9n0/oFBoVDolFo1HpFJpVLplNp1PqFRqVTql"
	var_s = var_s + "Vq1XrFZrVbrldr1fsFhsVjslls1ntFptVrtltt1vuFxuVzul1u13vF5vV7vl9v1/wGBwWDwmFw2HxGJxWLxmNx0xiFdyOTh8Tf9ZymXx+QytcyNgz8r0OblWjyWds+m0"
	var_s = var_s + "ka1Vf1ta1+r1mos2xrG2xeZ0+a0W0qOx3GO4NV3WeyvD2XJ5XL5nN51aiw+lfSj0gkUkAEllHanHI5j/cHg8EZf7w8vl8j4f/qfEZeB09/vjLAB30+kZQAP/P5/H6/yN"
	var_s = var_s + "AOAEAwCjMBwFAEDwJBMDwLBYAP2/8Hv8/gAGAD8LQs9w/nhDY/oygIA="
	.Images(var_s)
	.Chart.PaneWidth(1) = 0
	.Columns.Add("Default")
	with .Items
		.DefaultItem = .AddItem("Item 1")
		.CellImages(0,0) = "3,2,1"
		.DefaultItem = .AddItem("Item 2")
		.CellImages(0,0) = "2,3"
		.DefaultItem = .AddItem("Item 3")
		.CellImages(0,0) = "2"
	endwith
	.EndUpdate
endwith
|
|
2038
|
I have an EBN bar. Now if I apply an additional color to the bar, e,g, yellow, the bar is displayed as "dark yellow", which I assume is due to the black EBN color. How can I get the more "bright yellow" color
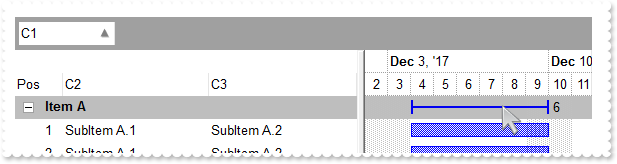
*** AddGroupItem event - Occurs after a new Group Item has been inserted to Items collection. ***
LPARAMETERS Item
	with thisform.G2antt1
		with .Items
			.DefaultItem = Item
			.ItemDividerLine(0) = 0
			.AddBar(Item,"Summary",{^2017-12-2},{^2017-12-2})
			.DefineSummaryBars(Item,"",-3,"")
			l = .GroupItem(Item)
			.DefaultItem = Item
			.CellSingleLine(0,l) = .F.
			.DefaultItem = Item
			.CellBold(0,l) = .T.
			.DefaultItem = Item
			.ItemBackColor(0) = RGB(190,190,190)
		endwith
		.DefaultItem = Item
		.Chart.ItemBackColor(0) = RGB(190,190,190)
	endwith

*** AddItem event - Occurs after a new Item has been inserted to Items collection. ***
LPARAMETERS Item
	with thisform.G2antt1
		.Items.AddBar(Item,"Task",{^2017-12-4},{^2017-12-10})
	endwith

with thisform.G2antt1
	.BeginUpdate
	with .VisualAppearance
		var_s = "gBFLBCJwBAEHhEJAAEhABOUGACAADACAxRDgMQBQKAAzAJBIYhiG4cYCgMZhXDOCYXABCEYRXBIZQ7BKNIxjSJwFgmEgADCMQwAFBIbhrE4ZBjHGQRUgyI43RhHUBzVI"
		var_s = var_s + "UBxDEaTZLlEYJBgeHYhDJPcaUVDcWQHGyeZwjSgpKoWSJIU5NcggPDgEwTKCmKlTAKoSzJMyEmwWRAdVTZLSEaxierKPhyWT/XgAF4PfDFKRXFqXY5mKZJFqKOI8TxIN"
		var_s = var_s + "gxPQMGyrBqraLqKwQGrGCQKSBhUZ3dS2JR3OSlYRuQAMVgOXoDZhPWZXbDtSzPE63NgtOR5DiGWalABoeoxRa9cz3ViCJSrGTqIoINIzZLHFQbPpdAYdP6BeIjXhhZxB"
		var_s = var_s + "BuLZXmEOh9CcNoni2N4MjWVodh+DpfBeLJinsWR9AyYwVAkGBhEAFphGiRogDEGBamkFgtjcZgHiMbgehYaQhAIEIREAaQYkcQZUHIGRUGQDBOEaBAhDYDxGkMZAkCge"
		var_s = var_s + "oagYZAYEYAYIAWGhemICIFj8WIiCiFR5gkIhogmBoKGKJx2C6C5hniMgggqYwog0UoNGMZJiDiCZRgOLY0ECUAQICA=="
		.Add(1,var_s)
		.RenderType = -268435456
	endwith
	with .Chart
		.LevelCount = 2
		.FirstVisibleDate = {^2017-12-2}
		.PaneWidth(0) = 342
		with .Bars.Item("Summary")
			.StartShape = 0
			.EndShape = 0
			.Shape = 1
			.Color = 0x1ff0000
			.Def(3) = "<%=%513%>"
			.Def(4) = 18
		endwith
	endwith
	with .Columns
		.Add("C1")
		.Add("C2")
		.Add("C3")
		with .Add("Pos")
			.FormatColumn = "1 pos ``"
			.AllowGroupBy = .F.
			.Position = 0
			.Width = 48
			.AllowSizing = .F.
		endwith
	endwith
	.SortBarVisible = .T.
	.SortBarCaption = "Drag a <b>column</b> header here to group by that column."
	.AllowGroupBy = .T.
	.HasLines = 0
	.LinesAtRoot = 0
	with .Items
		h = .AddItem("Item A")
		.DefaultItem = h
		.CellValue(0,1) = "SubItem A.1"
		.DefaultItem = h
		.CellValue(0,2) = "SubItem A.2"
		h = .AddItem("Item A")
		.DefaultItem = h
		.CellValue(0,1) = "SubItem A.1"
		.DefaultItem = h
		.CellValue(0,2) = "SubItem A.2"
		h = .AddItem("Item A")
		.DefaultItem = h
		.CellValue(0,1) = "SubItem A.1"
		.DefaultItem = h
		.CellValue(0,2) = "SubItem A.2"
		h = .AddItem("Item A")
		.DefaultItem = h
		.CellValue(0,1) = "SubItem A.1"
		.DefaultItem = h
		.CellValue(0,2) = "SubItem A.2"
		h = .AddItem("Item B")
		.DefaultItem = h
		.CellValue(0,1) = "SubItem B.1"
		.DefaultItem = h
		.CellValue(0,2) = "SubItem B.2"
		h = .AddItem("Item B")
		.DefaultItem = h
		.CellValue(0,1) = "SubItem B.1"
		.DefaultItem = h
		.CellValue(0,2) = "SubItem B.2"
	endwith
	with .Columns.Item(0)
		.SortOrder = 1
	endwith
	.EndUpdate
endwith
|
|
2037
|
Is it possible to change the visual appearance of the position signs when user changes the column's position by drag and drop
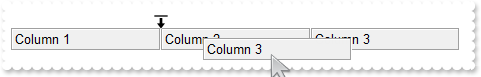
with thisform.G2antt1
	.BeginUpdate
	.HeaderAppearance = 4
	with .Columns
		.Add("Column 1")
		.Add("Column 2")
		.Add("Column 3")
	endwith
	with .VisualAppearance
		var_s = "gBFLBCJwBAEHhEJAAEhABZEGACAADACAxRDgMQBQKAAzAJBIYhiG4cYCgMYxXDOCYXABCEYRXBIZQ7BKNIxjSJwFgmEgADKMA4SOKIZhrE4bBhGaQRUgyI43RhHUBzVI"
		var_s = var_s + "UcQvE6TZRHCQYHgkNIhDJIM7TPLkeSVJaTIRoKhJUogApQThTMgVRDEThkGoSa6soSoYTDBKybLrSLKagOT5YUDKUqSdKEZRpEq1YztWbaQoCUoqVRRVIWfbNd4JJa4a"
		var_s = var_s + "DhWpYdpeeY5R7bWLgBYVVABL7LLRsSxpHxPF6RXxaeI3GKsaS8G6ic6nPQMHj7I4NS5pUa6Rh2VYNSa8AAtETRYznOw4bTMXAjNIea5bAYIIR5HIoDzVbQcCQAHL9DBe"
		var_s = var_s + "EMIQEEISgGhMGZQmocgymoYRRCIEQ0G2HYBnEIBig4V4zCQGINnmagCECY43medZ6H2Pw/g+X5fnueh/h+R5+AKABfkMWgGgGYA4AICoCGCE5WA4CphACMgSD2IRIDIB"
		var_s = var_s + "ICmEd5YGCBpRjGBgegWIYIgWdgoGIRQsiKCZiAiJZ0gGQI4jUS4LECOAiBmDJflGfg2BSY4Al4OhGkOCJ2DgFJjGGfgqgiH5Ch4RhGkqOQmEOEpkFkHQYhJRYyESAokG"
		var_s = var_s + "KHhIhKIxJEmf4VGUeRGFmF5iBkchPhYJQ5GoYIZg6Ug6GoFYmkmNhuhulRGHKGoImefh0BUZ4JmYeoemeSZ2H6HQmgoBgXDqXwUAQgI="
		.Add(1,var_s)
		.Add(2,"CP:1 0 -36 0 0")
	endwith
	.Object.Background(182) = 0x2000000
	.EndUpdate
endwith
|
|
2036
|
Overlaid-Types
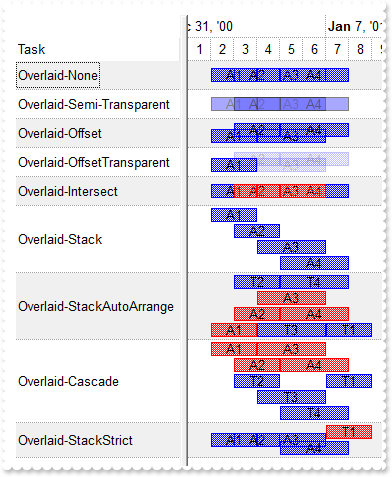
*** AddItem event - Occurs after a new Item has been inserted to Items collection. ***
LPARAMETERS Item
	with thisform.G2antt1
		with .Items
			barName = .ItemData(Item)
			.AddBar(Item,barName,{^2001-1-2},{^2001-1-4},"A1")
			.AddBar(Item,barName,{^2001-1-3},{^2001-1-5},"A2")
			.AddBar(Item,barName,{^2001-1-4},{^2001-1-7},"A3")
			.AddBar(Item,barName,{^2001-1-5},{^2001-1-8},"A4")
		endwith
	endwith

with thisform.G2antt1
	.BeginUpdate
	.DefaultItemHeight = 22
	.Columns.Add("Task")
	.ScrollBySingleLine = .T.
	.BackColorAlternate = RGB(240,240,240)
	.DrawGridLines = 1
	with .Chart
		.DrawGridLines = 1
		.ShowNonworkingDates = .F.
		.PaneWidth(0) = 164
		.FirstVisibleDate = {^2000-12-28}
		.LevelCount = 2
		.Bars.Copy("Task","Intersect").Color = RGB(255,0,0)
		.Bars.Item("Task").OverlaidType = 0
		with .Bars.Copy("Task","Task-Transparent")
			.OverlaidType = 0
			.Def(19) = 50
			.Pattern = 32
			.Color = RGB(0,0,0)
			.StartColor = RGB(80,80,255)
			.EndColor = .StartColor
		endwith
		.Bars.Copy("Task","Task-Offset").OverlaidType = 1
		with .Bars.Copy("Task","Task-OffsetTransparent")
			.OverlaidType = 257 && OverlaidBarsTypeEnum.exOverlaidBarsTransparent Or OverlaidBarsTypeEnum.exOverlaidBarsOffset
			.Overlaid(256) = 75
		endwith
		with .Bars.Copy("Task","Task-Intersect")
			.OverlaidType = 2
			.Overlaid(2) = "Intersect"
		endwith
		.Bars.Copy("Task","Task-Stack").OverlaidType = 3
		with .Bars.Copy("Task","Task-StackAutoArrange")
			.OverlaidType = 515 && OverlaidBarsTypeEnum.exOverlaidBarsStackAutoArrange Or OverlaidBarsTypeEnum.exOverlaidBarsStack
			.Color = RGB(255,0,0)
			.OverlaidGroup = "Task"
		endwith
		with .Bars.Copy("Task","Task-Cascade")
			.OverlaidType = 4
			.Color = RGB(255,0,0)
			.OverlaidGroup = "Task"
		endwith
		with .Bars.Copy("Task","Task-Strict")
			.OverlaidType = 8195 && OverlaidBarsTypeEnum.exOverlaidBarsStrict Or OverlaidBarsTypeEnum.exOverlaidBarsStack
			.OverlaidGroup = "Task"
			.Color = RGB(255,0,0)
		endwith
	endwith
	with .Items
		.InsertItem(0,"Task","Overlaid-None")
		.InsertItem(0,"Task-Transparent","Overlaid-Semi-Transparent")
		.InsertItem(0,"Task-Offset","Overlaid-Offset")
		.InsertItem(0,"Task-OffsetTransparent","Overlaid-OffsetTransparent")
		.InsertItem(0,"Task-Intersect","Overlaid-Intersect")
		.InsertItem(0,"Task-Stack","Overlaid-Stack")
		h = .InsertItem(0,"Task-StackAutoArrange","Overlaid-StackAutoArrange")
		.AddBar(h,"Task",{^2001-1-7},{^2001-1-9},"T1")
		.AddBar(h,"Task",{^2001-1-3},{^2001-1-5},"T2")
		.AddBar(h,"Task",{^2001-1-4},{^2001-1-7},"T3")
		.AddBar(h,"Task",{^2001-1-5},{^2001-1-8},"T4")
		h = .InsertItem(0,"Task-Cascade","Overlaid-Cascade")
		.AddBar(h,"Task",{^2001-1-7},{^2001-1-9},"T1")
		.AddBar(h,"Task",{^2001-1-3},{^2001-1-5},"T2")
		.AddBar(h,"Task",{^2001-1-4},{^2001-1-7},"T3")
		.AddBar(h,"Task",{^2001-1-5},{^2001-1-8},"T4")
		.DefaultItem = h
		.ItemBar(0,"<A*>",52) = "A"
		.DefaultItem = h
		.ItemBar(0,"<T*>",52) = "T"
		h = .InsertItem(0,"Task","Overlaid-StackStrict")
		.AddBar(h,"Task-Strict",{^2001-1-7},{^2001-1-9},"T1")
		.ItemBar(0,"<*>",3) = "<%=%9%>"
	endwith
	.EndUpdate
endwith
|
|
2035
|
FilterBarCaption ALLUI Keyword ( sample 3, result, leaf )
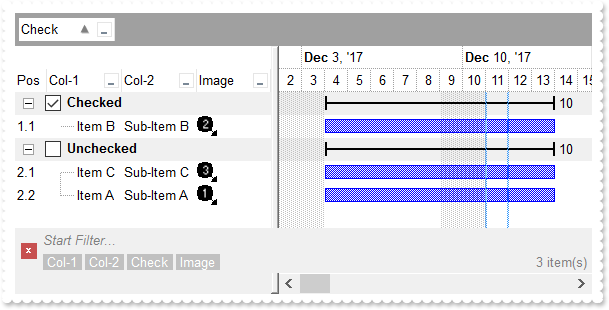
*** AddGroupItem event - Occurs after a new Group Item has been inserted to Items collection. ***
LPARAMETERS Item
	with thisform.G2antt1
		with .Items
			.DefaultItem = Item
			.ItemBackColor(0) = RGB(240,240,240)
			val = .CellValue(Item,.GroupItem(Item))
			.DefaultItem = Item
			.CellState(0,.GroupItem(Item)) = thisform.G2antt1.FormatABC("A = `Checked` ? 1 : 0",val)
		endwith
		with .Items
			.DefaultItem = Item
			.ItemDividerLine(0) = 0
			.AddBar(Item,"Summary",{^2017-12-2},{^2017-12-2})
			.DefineSummaryBars(Item,"",-3,"")
			l = .GroupItem(Item)
			.DefaultItem = Item
			.CellSingleLine(0,l) = .F.
			.DefaultItem = Item
			.CellBold(0,l) = .T.
		endwith
		.DefaultItem = Item
		.Chart.ItemBackColor(0) = RGB(240,240,240)
	endwith

*** AddItem event - Occurs after a new Item has been inserted to Items collection. ***
LPARAMETERS Item
	with thisform.G2antt1
		i = .FormatABC("value + 1",.Items.ItemToIndex(Item))
		.DefaultItem = Item
		.Items.CellImage(0,3) = i
		.Items.AddBar(Item,"Task",{^2017-12-4},{^2017-12-14})
	endwith

with thisform.G2antt1
	.BeginUpdate
	var_s = "gBFLBCJwBAEHhEJAAEhABOUGACAADACAxRDgMQBQKAAzAJBIYhiG4cYCgMZhXDOCYXABCEYRXBIZQ7BKNIxjSJwFgmEgADCMQwAFBIbhrE4ZBjHGQRUgyI43RhHUBzVI"
	var_s = var_s + "UBxDEaTZLlEYJBgeHYhDJPcaUVDcWQHGyeZwjSgpKoWSJIU5NcggPDgEwTKCmKlTAKoSzJMyEmwWRAdVTZLSEaxierKPhyWT/XgAF4PfDFKRXFqXY5mKZJFqKOI8TxIN"
	var_s = var_s + "gxPQMGyrBqraLqKwQGrGCQKSBhUZ3dS2JR3OSlYRuQAMVgOXoDZhPWZXbDtSzPE63NgtOR5DiGWalABoeoxRa9cz3ViCJSrGTqIoINIzZLHFQbPpdAYdP6BeIjXhhZxB"
	var_s = var_s + "BuLZXmEOh9CcNoni2N4MjWVodh+DpfBeLJinsWR9AyYwVAkGBhEAFphGiRogDEGBamkFgtjcZgHiMbgehYaQhAIEIREAaQYkcQZUHIGRUGQDBOEaBAhDYDxGkMZAkCge"
	var_s = var_s + "oagYZAYEYAYIAWGhemICIFj8WIiCiFR5gkIhogmBoKGKJx2C6C5hniMgggqYwog0UoNGMZJiDiCZRgOLY0ECUAQICA=="
	.VisualAppearance.Add(1,var_s)
	with .Chart
		.LevelCount = 2
		.FirstVisibleDate = {^2017-12-2}
		.PaneWidth(0) = 256
		with .Bars.Item("Summary")
			.StartShape = 0
			.EndShape = 0
			.Shape = 1
			.Color = 0x1000000
			.Def(3) = "<%=%513%>"
			.Def(4) = 18
		endwith
	endwith
	var_s1 = "gBJJgBAIDAAGAAEAAQhYAf8Pf4hh0QihCJo2AEZjQAjEZFEaIEaEEaAIAkcbk0olUrlktl0vmExmUzmk1m03nE5nU7nk9n0/oFBoVDolFo1HpFJpVLplNp1PqFRqVTql"
	var_s1 = var_s1 + "Vq1XrFZrVbrldr1fsFhsVjslls1ntFptVrtltt1vuFxuVzul1u13vF5vV7vl9v1/wGBwWDwmFw2HxGJxWLxmNx0xiFdyOTh8Tf9ZymXx+QytcyNgz8r0OblWjyWds+m0"
	var_s1 = var_s1 + "ka1Vf1ta1+r1mos2xrG2xeZ0+a0W0qOx3GO4NV3WeyvD2XJ5XL5nN51aiw+lfSj0gkUkAEllHanHI5j/cHg8EZf7w8vl8j4f/qfEZeB09/vjLAB30+kZQAP/P5/H6/yN"
	var_s1 = var_s1 + "AOAEAwCjMBwFAEDwJBMDwLBYAP2/8Hv8/gAGAD8LQs9w/nhDY/oygIA="
	.Images(var_s1)
	with .Columns.Add("Col-1")
		.DisplayFilterButton = .T.
		.FilterList = 9504 && FilterListEnum.exShowExclude Or FilterListEnum.exShowFocusItem Or FilterListEnum.exShowCheckBox Or FilterListEnum.exSortItemsAsc
	endwith
	with .Columns.Add("Col-2")
		.DisplayFilterButton = .T.
		.FilterList = 9504 && FilterListEnum.exShowExclude Or FilterListEnum.exShowFocusItem Or FilterListEnum.exShowCheckBox Or FilterListEnum.exSortItemsAsc
	endwith
	with .Columns.Add("Check")
		.Def(0) = .T.
		.DisplayFilterButton = .T.
		.DisplayFilterPattern = .F.
		.FilterType = 6
	endwith
	with .Columns.Add("Image")
		.DisplayFilterButton = .T.
		.FilterType = 10
		.FilterList = 9472 && FilterListEnum.exShowExclude Or FilterListEnum.exShowFocusItem Or FilterListEnum.exShowCheckBox
	endwith
	with .Columns.Add("Pos")
		.AllowSizing = .F.
		.AllowSort = .F.
		.Width = 32
		.FormatColumn = "1 rpos ``"
		.Position = 0
	endwith
	with .Items
		.DefaultItem = .AddItem("Item A")
		.CellValue(0,1) = "Sub-Item A"
		h = .AddItem("Item B")
		.DefaultItem = h
		.CellValue(0,1) = "Sub-Item B"
		.DefaultItem = h
		.CellState(0,2) = 1
		.DefaultItem = .AddItem("Item C")
		.CellValue(0,1) = "Sub-Item C"
	endwith
	.FilterBarFont = .Font
	.Object.Description(11) = .FormatABC("`<fgcolor=808080> ` + value + ` </fgcolor>`",.Description(11))
	var_s2 = "(( ( allui replace `[<b>` with `<bgcolor=000000><fgcolor=FFFFFF><b> ` replace `</b>]` with ` </b></bgcolor></fgcolor>` replace `"
	var_s2 = var_s2 + "[<s>` with `<bgcolor=C0C0C0><fgcolor=FFFFFF> ` replace `</s>]` with ` </fgcolor></bgcolor>` )  + `<r><fgcolor=808080>` + ( match"
	var_s2 = var_s2 + "itemcount < 0 ? ( ( len(value) ? `` : `` ) + `<r>` + leafitemcount + ` result(s)` ) : (`<r><fgcolor=808080>`+ leafitemcount + ` "
	var_s2 = var_s2 + "item(s)`) )))"
	.FilterBarCaption = var_s2
	.FilterBarPromptVisible = 3 && FilterBarVisibleEnum.exFilterBarVisible Or FilterBarVisibleEnum.exFilterBarPromptVisible
	.AllowGroupBy = .T.
	.SortBarVisible = .T.
	with .Columns.Item(2)
		.FormatColumn = "%CS2 ? `Checked` : `Unchecked`"
		.SortOrder = 1
	endwith
	.EndUpdate
endwith
|
|
2034
|
A black portion is shown while I am using the BackColorAlternate with EBN colors. What can I do
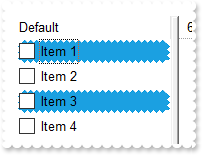
with thisform.G2antt1
	.BeginUpdate
	.ColumnAutoResize = .T.
	.DefaultItemHeight = 20
	var_s = "gBFLBCJwBAEHhEJAAEhIDhAxHAxg0HG0Mg4xGI3HMOig3GcJiYAf8jAEhhUnAAyhEqg8hk0oAsIjgAiAwmYxGA4mYzGwwkI0i0ooUnB0IBMIl1Dg8zmYyGolptPkI1mY"
	var_s = var_s + "1GAll9KoUslNIrVCqNQldShFUstXAVfrVcrlZtVhuFnsUHq1zoczoQGhFBkNpg6zbDykUkhsPHE2h85nc9n8xtVDtlex9Msd2p1YstVq9ux8HyMtzuFz1PsNTzQlv2hh"
	var_s = var_s + "WfkuqpeVuN0q+nvEooN5veSAGpkb/ACcZrvhU3w83nM/poxGuchGpoVBvWgg+8knA4WimnFxI45Er5XOlHMg/Q3XU33W4ew9Wyu11mchDagcO7zus8VDoNBBEIKBpMY6"
	var_s = var_s + "DqOQyokhA/IQIQmwMk4bIQFDcoO6LWgwhQkNcABwEyAB5GwWbet6cRQg3DENQ5D8QxADZvEkAB8nabsURGeBpFM3pwE2AEZRpDx/neZpOR3Dz9oO/r/wCMoZNTBQAQRJ"
	var_s = var_s + "SEwYg8HPGhEIoNCaEwq10gQ2WcRt7LcRxRFpuxUAEURQ3sczBEMgTTG8gN7HpOSEAEiQBAQZpmQ0DibPUFwbKcHwkhQoQtNQNzNEMbABOKDy/DMYQzHLeoPL0OTJSUd0"
	var_s = var_s + "pHcxTewk5zrIygIRPslz4lEngBKIAQivgASs/kLSBTlO00f8t0vGcgUbDlDRjXLCUNRERRvRgAHW2oAICA=="
	.VisualAppearance.Add(1,var_s)
	with .Columns.Add("Default")
		.Def(0) = .T.
		.PartialCheck = .T.
	endwith
	with .Columns.Add("Position")
		.FormatColumn = "1 rindex ``"
		.Visible = .F.
	endwith
	with .ConditionalFormats.Add("%C1 mod 2")
		.BackColor = 0x1000000
	endwith
	with .Items
		.AddItem("Item 1")
		.AddItem("Item 2")
		.AddItem("Item 3")
		.AddItem("Item 4")
	endwith
	.EndUpdate
endwith
|
|
2033
|
How can I specify alternate background colors for each root item, similar with BackColorAlternate
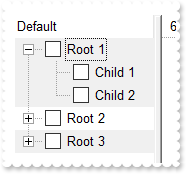
with thisform.G2antt1
	.BeginUpdate
	.LinesAtRoot = -1
	with .Columns.Add("Default")
		.Def(0) = .T.
		.PartialCheck = .T.
	endwith
	with .Columns.Add("Position")
		.FormatColumn = "( ( 1:=( ( 0:=(1 rpos '') ) lfind `.`) ) < 0 ? =:0 : (=:0 left =:1) )"
		.Visible = .F.
	endwith
	with .ConditionalFormats.Add("%C1 mod 2")
		.BackColor = RGB(240,240,240)
	endwith
	with .Items
		h = .AddItem("Root 1")
		.InsertItem(h,Null,"Child 1")
		.InsertItem(h,Null,"Child 2")
		.DefaultItem = h
		.ExpandItem(0) = .T.
		h = .AddItem("Root 2")
		.InsertItem(h,Null,"Child 1")
		.InsertItem(h,Null,"Child 2")
		h = .AddItem("Root 3")
		.InsertItem(h,Null,"Child 1")
		.InsertItem(h,Null,"Child 2")
	endwith
	.EndUpdate
endwith
|
|
2032
|
How can I change the visual appearance of the +/- buttons, open/close glyphs as current visual theme (method 4)
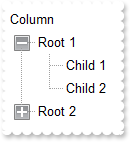
with thisform.G2antt1
	.BeginUpdate
	.LinesAtRoot = -1
	var_s = "gBFLBWIgBAEHhEJAEGg6VAkHeLpgwChAOhULB8XAUUg8MAAREEHGMcgRCJ0ei8dhABDEcQAAYAQGKIYBkAKBQAGaAoDDMOQwQwAAxjGKEEwsACEIrjKCRShyCYZRhGcT"
	var_s = var_s + "SBCIZBqEqSZLiEZRQiiCYsS5GQBRWAkEwiBiEQTjea5CgOIAFS7LIqjRQEBxhIaZYIGaiQADENo9TxIMZAfBIHShK6NJABCCSQKkYx0HScRijDIEFwGIQmbKiej4DCiC"
	var_s = var_s + "QQW7OYYRVCNMQSfa8HivJyrcamfp/YBgOBYHb1eLVPR5LwfPCGUw1P6PLxkORZHimK4tSLHV7xVpMIwZFafIQhCCoHomS5NU7UNR0TQUFx9FaGX7rDDsGwLAJ6XRgF4b"
	var_s = var_s + "g2VpnHePpenAN4bH2GwHFmApSjEGBLnWOpRGOTBZHOegrE6BxPiWVJqCweQrn0LgJAWJBjwgaw1gKO5HmWch5h+fovF+G5bmich4BgfZkB8dynRUVYqiUR5rnmex/F6N"
	var_s = var_s + "4tn2AJfnebZ3DEXw3HWXgzAyIwgicKJKBKEIhCeCgiHyHYFEmSAFmqBghFIdgSCeIJygYDAyAgJx6AoIINAMOJNCgCZCGoGoLmMCI+CwJoihMNglCCIhzFCUg0EmMhgh"
	var_s = var_s + "WDBkAiQg9CUY4jEYN4Jk2IxklYJoJHIUg+CSZJSESFwkkkGI+FOFIJEIRhPhMCRJCSVoRrSBhiDgTZjHYT4PEkYhwhgJYm0SaIaiaSYuE+GQNlmCIBGCJxjhiZQ5AkMh"
	var_s = var_s + "Ag6ExJCkPhPguaAiFYUAlAkKZ0g6HoOEmWR/GHcA4m0OwIlIJIHCRgQshGJhpjoaocieaZiC6GAimkUgehIOwnGYGYIGkah6jaE4rg6SpCjKK5rEOMYlGIGIihKOgglo"
	var_s = var_s + "Foqj6L5aGaBo6CkGIkAQjiPpCAAaJILCTJQlKPACDaXJgmSaJsnCdJ4nygKEoijKQpSmKcqCpKoqysK0rivLAsSyLMtC1LYty4Lkui7LwvS+L8wDBMIwzEMUxjHMgyTK"
	var_s = var_s + "MszDNM4zzQNE0jTNQ1TWNc2DZNo2zcN03jfOA4TiOM5DlOY5zoOk6jrOw7TuO88DxPI8z0PU9j3Pg+T6Ps/D9P4/0AQFAkDQRBUGQdCEJQpC0MQ1DkPRBEUSRNFEVBhF"
	var_s = var_s + "kXRhGQ9D6Dxfh+W5gGGd4QH2XQjCmDpFFaKoVB+D5Xmed5+H8YAHnIAh9EwV5Fl0d4MkMKJICmSgygSJAoEmMUCIPgnDCCIOQFYCxJjwFoCcA4kxoF+AIJkAgExegDEg"
	var_s = var_s + "EYQInAzCUAIOEGgfxiiRDYF1Q4EQ2BSCaEQYwbAiKREMpRSymFNDIAkAxT6oVRgSA2qdVKq1WqvVirMZQUhSCnBUMoIgoQRgnGSIQUgkg1hIHYAkAYMROAmHiLsE4xxS"
	var_s = var_s + "CxBwEwCQ0wmDdBsE0GYXBtg2CSPMFIuwYiQBYBQeAcwOCnBCCZgw0g0glBONAQgqQThCGgPQGoBQfiRGmOEZIPAXjsBoPAO4HRThhA0EQSA5BAgaCKJIGg3QdhOCmNUB"
	var_s = var_s + "oQAijTCIF0FwQxpCHDIPAYYMQGgtCmFcaQtRAjZCyFYSojQ2B2BoKwIYFApBXEIBsIQ1QsAWAWEwaA1xCgjAoIAQBAQ="
	.VisualDesign = var_s
	.Columns.Add("Column")
	with .Items
		h = .AddItem("Root 1")
		.InsertItem(h,Null,"Child 1")
		.InsertItem(h,Null,"Child 2")
		.DefaultItem = h
		.ExpandItem(0) = .T.
		h = .AddItem("Root 2")
		.InsertItem(h,Null,"Child")
	endwith
	.EndUpdate
endwith
|
|
2031
|
How can I change the visual appearance of the +/- buttons, open/close glyphs as current visual theme (method 3)
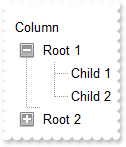
with thisform.G2antt1
	.BeginUpdate
	with .VisualAppearance
		var_s = "gBFLBCJwBAEHhEJAAEhABDwCg6AADACAxRDgMQBQKAAzAJBIYhiG4cYCgMZhXDOCYXABCEYRXBIZQ7BKNIxjSJ5BhIAAyDSJMjSRJUEhqGCWYDleYYYAKHIMQLJQKQSB"
		var_s = var_s + "cQR9EaBZBAWTpQC0OJDTJRI4TNAgbSYAAYRqoCb6loTKypaxjCQQIgkUBpGKdBynEYsDwSGyJCCJWyIbpKAwoVbcs4AYhuJpaQi+d5PFbjVT8dLAMBwLA8EwXAJ+OpfD"
		var_s = var_s + "xXU7eFKpR5fchXTI8UxXFqXZhkeQrfh7KYVRBKdBQRBEFQPJqnahqOpaXo2RoLUJKcQwHTmHYNQTALyuTALZrWeZ3XrgN74LbtZzVQauYRpbCMEr6bpoWLnFi6Ho1U4l"
		var_s = var_s + "lWah1jqSweFqfxPgQQRphi+Yak0YIuqUfJegef4zluaJ3nqPJeCYH4BAeX5TDLBpVGqKRRnwf4flefZtHsX54BYAR/F+EwVnUd5eAMMJKDIChygyIQpAoEh4iIJ5JlgX"
		var_s = var_s + "IcgCXpIGoFwnGEQh6BEKBgmMIICHgIJCAiUAzgyUoAhwJohkiRgygwYpiGoKwzGIcgKCkNQNCMRIbCYCRYk4QoMiOchWDwNBjhiJJaDYTRiGiFwlCQAhOE8JBJHITIRg"
		var_s = var_s + "wZRZFCFCZBkOIUhKTRpCWAwgGYQ4El4NxlBifIWCcCYCFoaoMGaKYyG6GxlBmGJdhkCAWBIeA5g4U4QhMJAImkPIShRVxGgQJRlCIUISh+SJpnCZIeBgFgiHgO4OlOMI"
		var_s = var_s + "NCISByECDQikkGhuh2JwpmqBogCKaYiC6FwhmkQ4yHgYgYiaHopiuaRakCbIsisSpGjYOwaHYKYMCkK5CA2IxrCwCwFigaJrkLTI6lcdANAEgIA="
		.Add(3,var_s)
		.Add(1,"CP:3 -2 -2 2 2")
		var_s1 = "gBFLBCJwBAEHhEJAAEhABEICg6AADACAxRDgMQBQKAAzAJBIYhiG4cYCgMZhXDOCYXABCEYRXBIZQ7BKNIxjSJ5BhIAAyDSJMjSRJUEhqGCWYDleYYYAKHIMQLJQKQSB"
		var_s1 = var_s1 + "cQR9EaBZBAWTpQC0OJDTJRI4TNAgbSYAAYRqoCb6loTKypaxjCQQIgkUBpGKdBynEYsDwSGyJCCJWyIbpKAwoVbcs4AYhuJpaQi+d5PFbjVT8dLAMBwLA8EwXAJ+OpfD"
		var_s1 = var_s1 + "xXU7eFKpR5fchXTI8UxXFqXZhkeQrfh7KYVRBKdBQRBEFQPJqnahqOpaXo2RoLUJKcQwHTmHYNQTALyuTALZrWeZ3XrgN74LbtZzVQauYRpbCMEr6bpoWLnFi6Ho1U4l"
		var_s1 = var_s1 + "lWah1jqSweFqfxPgQQRphi+Yak0YIuqUfJeg8X4rluaZ3niGB+AQHx/EyShjjEVYqiUR5rnmex/GAB5+AIf4gEeXJFHyXZ3gCTAygyAociMKBKEKBIeCiCZyHYFAnCEe"
		var_s1 = var_s1 + "Bkh+BghFgRIegOCgYCySAgh4CAkgINAMmMNIgCcCYjn4LoLmMCJGDKC5ijIagoDMYhCAoJg1A0IxEhsJgJFiThChCY5yFYPA0GOGIYloNhNGIaIXCUJACE4TwkEkchOF"
		var_s1 = var_s1 + "SFYlFkXhUCUCQZEYTglCSMxaEkYJIBmFJhDeDZZEYPwlgmQhghaGqVDoa4bGaeY6FGGZNlmFIBGEJ4jhiZQ5AkMhAg6E5JCkRoGCUSQ6B6CYiSCBIOh+DhJmmARiWQOJ"
		var_s1 = var_s1 + "tDsCJSCSBwkXSLIRicaZ6HqIIomoIguhwIpphIHoWDsJ4mCGChpmqOpGheLIOkqUo2iya4DjGJxihiQoSj4IJaDaMpCjCWoGg6PgpBiQ4tHcQJQBAgI="
		.Add(4,var_s1)
		.Add(2,"CP:4 -2 -2 2 2")
	endwith
	.LinesAtRoot = 1
	.HasButtons = 4
	.Object.HasButtonsCustom(0) = 16777216
	.Object.HasButtonsCustom(1) = 33554432
	.Columns.Add("Column")
	with .Items
		h = .AddItem("Root 1")
		.InsertItem(h,Null,"Child 1")
		.InsertItem(h,Null,"Child 2")
		.DefaultItem = h
		.ExpandItem(0) = .T.
		h = .AddItem("Root 2")
		.InsertItem(h,Null,"Child")
	endwith
	.EndUpdate
endwith
|
|
2030
|
How can I change the visual appearance of the +/- buttons, open/close glyphs as current visual theme (method 2)
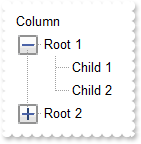
with thisform.G2antt1
	.BeginUpdate
	with .VisualAppearance
		.Add(1,"XP:TREEVIEW 2 1")
		.Add(2,"XP:TREEVIEW 2 2")
	endwith
	.Object.Background(180) = 0x1000000
	.Object.Background(181) = 0x2000000
	.LinesAtRoot = -1
	.Columns.Add("Column")
	with .Items
		h = .AddItem("Root 1")
		.InsertItem(h,Null,"Child 1")
		.InsertItem(h,Null,"Child 2")
		.DefaultItem = h
		.ExpandItem(0) = .T.
		h = .AddItem("Root 2")
		.InsertItem(h,Null,"Child")
	endwith
	.EndUpdate
endwith
|
|
2029
|
How can I find if the control is running in DPI mode
with thisform.G2antt1
	DEBUGOUT( .FormatABC("dpi = 1 ? `normal/stretch mode` : `dpi mode`") )
endwith
|
|
2028
|
How can I change the visual appearance of the +/- buttons (method 1)
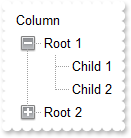
with thisform.G2antt1
	.BeginUpdate
	with .VisualAppearance
		var_s = "gBFLBCJwBAEHhEJAAEhABDwCg6AADACAxRDgMQBQKAAzAJBIYhiG4cYCgMZhXDOCYXABCEYRXBIZQ7BKNIxjSJ5BhIAAyDSJMjSRJUEhqGCWYDleYYYAKHIMQLJQKQSB"
		var_s = var_s + "cQR9EaBZBAWTpQC0OJDTJRI4TNAgbSYAAYRqoCb6loTKypaxjCQQIgkUBpGKdBynEYsDwSGyJCCJWyIbpKAwoVbcs4AYhuJpaQi+d5PFbjVT8dLAMBwLA8EwXAJ+OpfD"
		var_s = var_s + "xXU7eFKpR5fchXTI8UxXFqXZhkeQrfh7KYVRBKdBQRBEFQPJqnahqOpaXo2RoLUJKcQwHTmHYNQTALyuTALZrWeZ3XrgN74LbtZzVQauYRpbCMEr6bpoWLnFi6Ho1U4l"
		var_s = var_s + "lWah1jqSweFqfxPgQQRphi+Yak0YIuqUfJegef4zluaJ3nqPJeCYH4BAeX5TDLBpVGqKRRnwf4flefZtHsX54BYAR/F+EwVnUd5eAMMJKDIChygyIQpAoEh4iIJ5JlgX"
		var_s = var_s + "IcgCXpIGoFwnGEQh6BEKBgmMIICHgIJCAiUAzgyUoAhwJohkiRgygwYpiGoKwzGIcgKCkNQNCMRIbCYCRYk4QoMiOchWDwNBjhiJJaDYTRiGiFwlCQAhOE8JBJHITIRg"
		var_s = var_s + "wZRZFCFCZBkOIUhKTRpCWAwgGYQ4El4NxlBifIWCcCYCFoaoMGaKYyG6GxlBmGJdhkCAWBIeA5g4U4QhMJAImkPIShRVxGgQJRlCIUISh+SJpnCZIeBgFgiHgO4OlOMI"
		var_s = var_s + "NCISByECDQikkGhuh2JwpmqBogCKaYiC6FwhmkQ4yHgYgYiaHopiuaRakCbIsisSpGjYOwaHYKYMCkK5CA2IxrCwCwFigaJrkLTI6lcdANAEgIA="
		.Add(1,var_s)
		var_s1 = "gBFLBCJwBAEHhEJAAEhABEICg6AADACAxRDgMQBQKAAzAJBIYhiG4cYCgMZhXDOCYXABCEYRXBIZQ7BKNIxjSJ5BhIAAyDSJMjSRJUEhqGCWYDleYYYAKHIMQLJQKQSB"
		var_s1 = var_s1 + "cQR9EaBZBAWTpQC0OJDTJRI4TNAgbSYAAYRqoCb6loTKypaxjCQQIgkUBpGKdBynEYsDwSGyJCCJWyIbpKAwoVbcs4AYhuJpaQi+d5PFbjVT8dLAMBwLA8EwXAJ+OpfD"
		var_s1 = var_s1 + "xXU7eFKpR5fchXTI8UxXFqXZhkeQrfh7KYVRBKdBQRBEFQPJqnahqOpaXo2RoLUJKcQwHTmHYNQTALyuTALZrWeZ3XrgN74LbtZzVQauYRpbCMEr6bpoWLnFi6Ho1U4l"
		var_s1 = var_s1 + "lWah1jqSweFqfxPgQQRphi+Yak0YIuqUfJeg8X4rluaZ3niGB+AQHx/EyShjjEVYqiUR5rnmex/GAB5+AIf4gEeXJFHyXZ3gCTAygyAociMKBKEKBIeCiCZyHYFAnCEe"
		var_s1 = var_s1 + "Bkh+BghFgRIegOCgYCySAgh4CAkgINAMmMNIgCcCYjn4LoLmMCJGDKC5ijIagoDMYhCAoJg1A0IxEhsJgJFiThChCY5yFYPA0GOGIYloNhNGIaIXCUJACE4TwkEkchOF"
		var_s1 = var_s1 + "SFYlFkXhUCUCQZEYTglCSMxaEkYJIBmFJhDeDZZEYPwlgmQhghaGqVDoa4bGaeY6FGGZNlmFIBGEJ4jhiZQ5AkMhAg6E5JCkRoGCUSQ6B6CYiSCBIOh+DhJmmARiWQOJ"
		var_s1 = var_s1 + "tDsCJSCSBwkXSLIRicaZ6HqIIomoIguhwIpphIHoWDsJ4mCGChpmqOpGheLIOkqUo2iya4DjGJxihiQoSj4IJaDaMpCjCWoGg6PgpBiQ4tHcQJQBAgI="
		.Add(2,var_s1)
	endwith
	.LinesAtRoot = -1
	.Object.Background(180) = 0x1000000
	.Object.Background(181) = 0x2000000
	.Columns.Add("Column")
	with .Items
		h = .AddItem("Root 1")
		.InsertItem(h,Null,"Child 1")
		.InsertItem(h,Null,"Child 2")
		.DefaultItem = h
		.ExpandItem(0) = .T.
		h = .AddItem("Root 2")
		.InsertItem(h,Null,"Child")
	endwith
	.EndUpdate
endwith
|
|
2027
|
How can I add a summary bar once the user group by a column
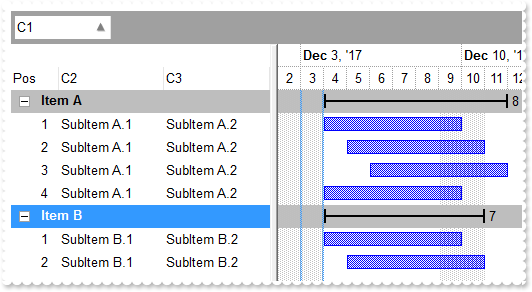
*** AddGroupItem event - Occurs after a new Group Item has been inserted to Items collection. ***
LPARAMETERS Item
	with thisform.G2antt1
		with .Items
			.DefaultItem = Item
			.ItemDividerLine(0) = 0
			.AddBar(Item,"Summary",{^2017-12-2},{^2017-12-2})
			.DefineSummaryBars(Item,"",-3,"")
			l = .GroupItem(Item)
			.DefaultItem = Item
			.CellSingleLine(0,l) = .F.
			.DefaultItem = Item
			.CellBold(0,l) = .T.
			.DefaultItem = Item
			.ItemBackColor(0) = RGB(190,190,190)
		endwith
		.DefaultItem = Item
		.Chart.ItemBackColor(0) = RGB(190,190,190)
	endwith

*** AddItem event - Occurs after a new Item has been inserted to Items collection. ***
LPARAMETERS Item
	with thisform.G2antt1
		.Items.AddBar(Item,"Task",{^2017-12-4},{^2017-12-10})
	endwith

with thisform.G2antt1
	.BeginUpdate
	var_s = "gBFLBCJwBAEHhEJAAEhABOUGACAADACAxRDgMQBQKAAzAJBIYhiG4cYCgMZhXDOCYXABCEYRXBIZQ7BKNIxjSJwFgmEgADCMQwAFBIbhrE4ZBjHGQRUgyI43RhHUBzVI"
	var_s = var_s + "UBxDEaTZLlEYJBgeHYhDJPcaUVDcWQHGyeZwjSgpKoWSJIU5NcggPDgEwTKCmKlTAKoSzJMyEmwWRAdVTZLSEaxierKPhyWT/XgAF4PfDFKRXFqXY5mKZJFqKOI8TxIN"
	var_s = var_s + "gxPQMGyrBqraLqKwQGrGCQKSBhUZ3dS2JR3OSlYRuQAMVgOXoDZhPWZXbDtSzPE63NgtOR5DiGWalABoeoxRa9cz3ViCJSrGTqIoINIzZLHFQbPpdAYdP6BeIjXhhZxB"
	var_s = var_s + "BuLZXmEOh9CcNoni2N4MjWVodh+DpfBeLJinsWR9AyYwVAkGBhEAFphGiRogDEGBamkFgtjcZgHiMbgehYaQhAIEIREAaQYkcQZUHIGRUGQDBOEaBAhDYDxGkMZAkCge"
	var_s = var_s + "oagYZAYEYAYIAWGhemICIFj8WIiCiFR5gkIhogmBoKGKJx2C6C5hniMgggqYwog0UoNGMZJiDiCZRgOLY0ECUAQICA=="
	.VisualAppearance.Add(1,var_s)
	with .Chart
		.LevelCount = 2
		.FirstVisibleDate = {^2017-12-2}
		.PaneWidth(0) = 342
		with .Bars.Item("Summary")
			.StartShape = 0
			.EndShape = 0
			.Shape = 1
			.Color = 0x1000000
			.Def(3) = "<%=%513%>"
			.Def(4) = 18
		endwith
	endwith
	with .Columns
		.Add("C1")
		.Add("C2")
		.Add("C3")
		with .Add("Pos")
			.FormatColumn = "1 pos ``"
			.AllowGroupBy = .F.
			.Position = 0
			.Width = 48
			.AllowSizing = .F.
		endwith
	endwith
	.SortBarVisible = .T.
	.SortBarCaption = "Drag a <b>column</b> header here to group by that column."
	.AllowGroupBy = .T.
	.HasLines = 0
	.LinesAtRoot = 0
	with .Items
		h = .AddItem("Item A")
		.DefaultItem = h
		.CellValue(0,1) = "SubItem A.1"
		.DefaultItem = h
		.CellValue(0,2) = "SubItem A.2"
		h = .AddItem("Item A")
		.DefaultItem = h
		.CellValue(0,1) = "SubItem A.1"
		.DefaultItem = h
		.CellValue(0,2) = "SubItem A.2"
		h = .AddItem("Item A")
		.DefaultItem = h
		.CellValue(0,1) = "SubItem A.1"
		.DefaultItem = h
		.CellValue(0,2) = "SubItem A.2"
		h = .AddItem("Item A")
		.DefaultItem = h
		.CellValue(0,1) = "SubItem A.1"
		.DefaultItem = h
		.CellValue(0,2) = "SubItem A.2"
		h = .AddItem("Item B")
		.DefaultItem = h
		.CellValue(0,1) = "SubItem B.1"
		.DefaultItem = h
		.CellValue(0,2) = "SubItem B.2"
		h = .AddItem("Item B")
		.DefaultItem = h
		.CellValue(0,1) = "SubItem B.1"
		.DefaultItem = h
		.CellValue(0,2) = "SubItem B.2"
	endwith
	with .Columns.Item(0)
		.SortOrder = 1
	endwith
	.EndUpdate
endwith
|
|
2026
|
Is it possible to display no +/- button for grouped items
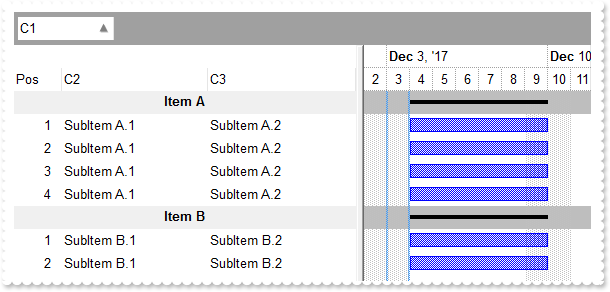
*** AddGroupItem event - Occurs after a new Group Item has been inserted to Items collection. ***
LPARAMETERS Item
	with thisform.G2antt1
		with .Items
			.DefaultItem = Item
			.ItemDividerLine(0) = 0
			.AddBar(Item,"Progress",{^2017-12-2},{^2017-12-2})
			.DefineSummaryBars(Item,"",-3,"")
			l = .GroupItem(Item)
			.DefaultItem = Item
			.CellSingleLine(0,l) = .F.
			.DefaultItem = Item
			.CellBold(0,l) = .T.
			.DefaultItem = Item
			.ItemBackColor(0) = RGB(190,190,190)
		endwith
		.DefaultItem = Item
		.Chart.ItemBackColor(0) = RGB(190,190,190)
	endwith

*** AddItem event - Occurs after a new Item has been inserted to Items collection. ***
LPARAMETERS Item
	with thisform.G2antt1
		.Items.AddBar(Item,"Task",{^2017-12-4},{^2017-12-10})
	endwith

with thisform.G2antt1
	.BeginUpdate
	with .Chart
		.LevelCount = 2
		.FirstVisibleDate = {^2017-12-2}
		.PaneWidth(0) = 342
	endwith
	with .Columns
		.Add("C1")
		.Add("C2")
		.Add("C3")
		with .Add("Pos")
			.FormatColumn = "1 pos ``"
			.AllowGroupBy = .F.
			.Position = 0
			.Width = 48
			.AllowSizing = .F.
		endwith
	endwith
	.SortBarVisible = .T.
	.SortBarCaption = "Drag a <b>column</b> header here to group by that column."
	.AllowGroupBy = .T.
	.HasLines = 0
	.LinesAtRoot = 0
	with .Items
		h = .AddItem("Item A")
		.DefaultItem = h
		.CellValue(0,1) = "SubItem A.1"
		.DefaultItem = h
		.CellValue(0,2) = "SubItem A.2"
		h = .AddItem("Item A")
		.DefaultItem = h
		.CellValue(0,1) = "SubItem A.1"
		.DefaultItem = h
		.CellValue(0,2) = "SubItem A.2"
		h = .AddItem("Item A")
		.DefaultItem = h
		.CellValue(0,1) = "SubItem A.1"
		.DefaultItem = h
		.CellValue(0,2) = "SubItem A.2"
		h = .AddItem("Item A")
		.DefaultItem = h
		.CellValue(0,1) = "SubItem A.1"
		.DefaultItem = h
		.CellValue(0,2) = "SubItem A.2"
		h = .AddItem("Item B")
		.DefaultItem = h
		.CellValue(0,1) = "SubItem B.1"
		.DefaultItem = h
		.CellValue(0,2) = "SubItem B.2"
		h = .AddItem("Item B")
		.DefaultItem = h
		.CellValue(0,1) = "SubItem B.1"
		.DefaultItem = h
		.CellValue(0,2) = "SubItem B.2"
	endwith
	with .Columns.Item(0)
		.SortOrder = 1
		.Alignment = 1
		.Def(4) = 15790320
	endwith
	.EndUpdate
endwith
|
|
2025
|
How can I change the label, caption or the formula of the grouped items
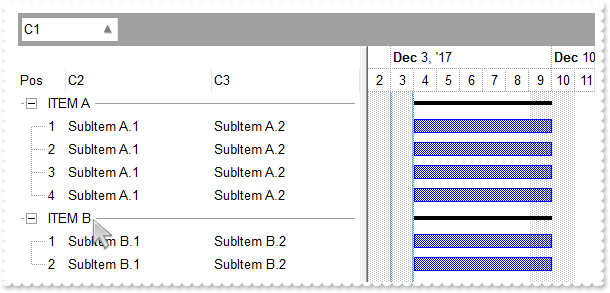
*** AddGroupItem event - Occurs after a new Group Item has been inserted to Items collection. ***
LPARAMETERS Item
	with thisform.G2antt1
		with .Items
			.AddBar(Item,"Progress",{^2017-12-2},{^2017-12-2})
			.DefineSummaryBars(Item,"",-3,"")
		endwith
	endwith

*** AddItem event - Occurs after a new Item has been inserted to Items collection. ***
LPARAMETERS Item
	with thisform.G2antt1
		.Items.AddBar(Item,"Task",{^2017-12-4},{^2017-12-10})
	endwith

with thisform.G2antt1
	.BeginUpdate
	with .Chart
		.LevelCount = 2
		.FirstVisibleDate = {^2017-12-2}
		.PaneWidth(0) = 342
	endwith
	with .Columns
		with .Add("C1")
			.GroupByTotalField = ""
			.GroupByFormatCell = "upper(value)"
		endwith
		.Add("C2")
		.Add("C3")
		with .Add("Pos")
			.FormatColumn = "1 pos ``"
			.AllowGroupBy = .F.
			.Position = 0
			.Width = 48
			.AllowSizing = .F.
		endwith
	endwith
	.SortBarVisible = .T.
	.SortBarCaption = "Drag a <b>column</b> header here to group by that column."
	.AllowGroupBy = .T.
	with .Items
		h = .AddItem("Item A")
		.DefaultItem = h
		.CellValue(0,1) = "SubItem A.1"
		.DefaultItem = h
		.CellValue(0,2) = "SubItem A.2"
		h = .AddItem("Item A")
		.DefaultItem = h
		.CellValue(0,1) = "SubItem A.1"
		.DefaultItem = h
		.CellValue(0,2) = "SubItem A.2"
		h = .AddItem("Item A")
		.DefaultItem = h
		.CellValue(0,1) = "SubItem A.1"
		.DefaultItem = h
		.CellValue(0,2) = "SubItem A.2"
		h = .AddItem("Item A")
		.DefaultItem = h
		.CellValue(0,1) = "SubItem A.1"
		.DefaultItem = h
		.CellValue(0,2) = "SubItem A.2"
		h = .AddItem("Item B")
		.DefaultItem = h
		.CellValue(0,1) = "SubItem B.1"
		.DefaultItem = h
		.CellValue(0,2) = "SubItem B.2"
		h = .AddItem("Item B")
		.DefaultItem = h
		.CellValue(0,1) = "SubItem B.1"
		.DefaultItem = h
		.CellValue(0,2) = "SubItem B.2"
	endwith
	.Columns.Item(0).SortOrder = 1
	.EndUpdate
endwith
|
|
2024
|
How can I change the aspect of grouped items
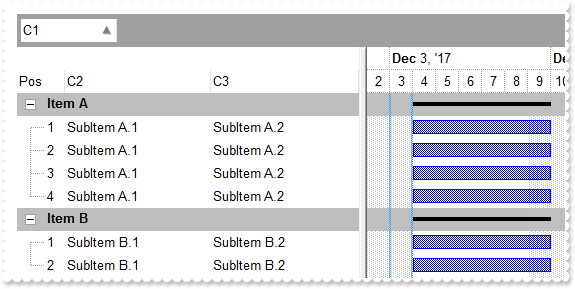
*** AddGroupItem event - Occurs after a new Group Item has been inserted to Items collection. ***
LPARAMETERS Item
	with thisform.G2antt1
		with .Items
			.DefaultItem = Item
			.ItemDividerLine(0) = 0
			.AddBar(Item,"Progress",{^2017-12-2},{^2017-12-2})
			.DefineSummaryBars(Item,"",-3,"")
			l = .GroupItem(Item)
			.DefaultItem = Item
			.CellSingleLine(0,l) = .F.
			.DefaultItem = Item
			.CellBold(0,l) = .T.
			.DefaultItem = Item
			.ItemBackColor(0) = RGB(190,190,190)
		endwith
		.DefaultItem = Item
		.Chart.ItemBackColor(0) = RGB(190,190,190)
	endwith

*** AddItem event - Occurs after a new Item has been inserted to Items collection. ***
LPARAMETERS Item
	with thisform.G2antt1
		.Items.AddBar(Item,"Task",{^2017-12-4},{^2017-12-10})
	endwith

with thisform.G2antt1
	.BeginUpdate
	with .Chart
		.LevelCount = 2
		.FirstVisibleDate = {^2017-12-2}
		.PaneWidth(0) = 342
	endwith
	with .Columns
		.Add("C1")
		.Add("C2")
		.Add("C3")
		with .Add("Pos")
			.FormatColumn = "1 pos ``"
			.AllowGroupBy = .F.
			.Position = 0
			.Width = 48
			.AllowSizing = .F.
		endwith
	endwith
	.SortBarVisible = .T.
	.SortBarCaption = "Drag a <b>column</b> header here to group by that column."
	.AllowGroupBy = .T.
	with .Items
		h = .AddItem("Item A")
		.DefaultItem = h
		.CellValue(0,1) = "SubItem A.1"
		.DefaultItem = h
		.CellValue(0,2) = "SubItem A.2"
		h = .AddItem("Item A")
		.DefaultItem = h
		.CellValue(0,1) = "SubItem A.1"
		.DefaultItem = h
		.CellValue(0,2) = "SubItem A.2"
		h = .AddItem("Item A")
		.DefaultItem = h
		.CellValue(0,1) = "SubItem A.1"
		.DefaultItem = h
		.CellValue(0,2) = "SubItem A.2"
		h = .AddItem("Item A")
		.DefaultItem = h
		.CellValue(0,1) = "SubItem A.1"
		.DefaultItem = h
		.CellValue(0,2) = "SubItem A.2"
		h = .AddItem("Item B")
		.DefaultItem = h
		.CellValue(0,1) = "SubItem B.1"
		.DefaultItem = h
		.CellValue(0,2) = "SubItem B.2"
		h = .AddItem("Item B")
		.DefaultItem = h
		.CellValue(0,1) = "SubItem B.1"
		.DefaultItem = h
		.CellValue(0,2) = "SubItem B.2"
	endwith
	.Columns.Item(0).SortOrder = 1
	.EndUpdate
endwith
|
|
2023
|
How can I collapse all items when the user performs a grouping
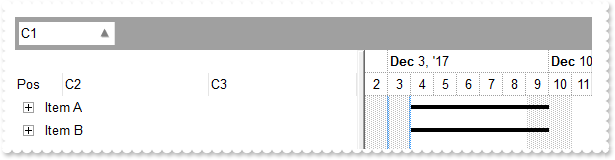
*** AddGroupItem event - Occurs after a new Group Item has been inserted to Items collection. ***
LPARAMETERS Item
	with thisform.G2antt1
		with .Items
			.DefaultItem = Item
			.ExpandItem(0) = .F.
			.DefaultItem = Item
			.ItemDividerLine(0) = 0
			.AddBar(Item,"Progress",{^2017-12-2},{^2017-12-2})
			.DefineSummaryBars(Item,"",-3,"")
		endwith
	endwith

*** AddItem event - Occurs after a new Item has been inserted to Items collection. ***
LPARAMETERS Item
	with thisform.G2antt1
		.Items.AddBar(Item,"Task",{^2017-12-4},{^2017-12-10})
	endwith

with thisform.G2antt1
	.BeginUpdate
	with .Chart
		.LevelCount = 2
		.FirstVisibleDate = {^2017-12-2}
		.PaneWidth(0) = 342
	endwith
	with .Columns
		.Add("C1")
		.Add("C2")
		.Add("C3")
		with .Add("Pos")
			.FormatColumn = "1 pos ``"
			.AllowGroupBy = .F.
			.Position = 0
			.Width = 48
			.AllowSizing = .F.
		endwith
	endwith
	.SortBarVisible = .T.
	.SortBarCaption = "Drag a <b>column</b> header here to group by that column."
	.AllowGroupBy = .T.
	with .Items
		h = .AddItem("Item A")
		.DefaultItem = h
		.CellValue(0,1) = "SubItem A.1"
		.DefaultItem = h
		.CellValue(0,2) = "SubItem A.2"
		h = .AddItem("Item A")
		.DefaultItem = h
		.CellValue(0,1) = "SubItem A.1"
		.DefaultItem = h
		.CellValue(0,2) = "SubItem A.2"
		h = .AddItem("Item A")
		.DefaultItem = h
		.CellValue(0,1) = "SubItem A.1"
		.DefaultItem = h
		.CellValue(0,2) = "SubItem A.2"
		h = .AddItem("Item A")
		.DefaultItem = h
		.CellValue(0,1) = "SubItem A.1"
		.DefaultItem = h
		.CellValue(0,2) = "SubItem A.2"
		h = .AddItem("Item B")
		.DefaultItem = h
		.CellValue(0,1) = "SubItem B.1"
		.DefaultItem = h
		.CellValue(0,2) = "SubItem B.2"
		h = .AddItem("Item B")
		.DefaultItem = h
		.CellValue(0,1) = "SubItem B.1"
		.DefaultItem = h
		.CellValue(0,2) = "SubItem B.2"
	endwith
	.Columns.Item(0).SortOrder = 1
	.EndUpdate
endwith
|
|
2022
|
Is it possible to select columns that user can drop to the sort bar, when using the Group By feature
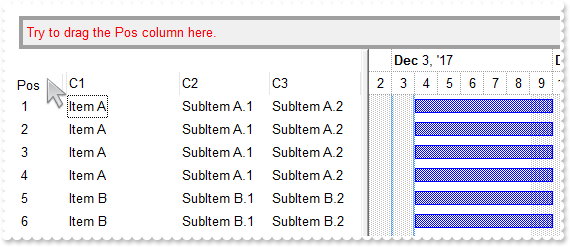
*** AddItem event - Occurs after a new Item has been inserted to Items collection. ***
LPARAMETERS Item
	with thisform.G2antt1
		.Items.AddBar(Item,"Task",{^2017-12-4},{^2017-12-10})
	endwith

with thisform.G2antt1
	.BeginUpdate
	with .Chart
		.LevelCount = 2
		.FirstVisibleDate = {^2017-12-2}
		.PaneWidth(0) = 342
	endwith
	with .Columns
		.Add("C1")
		.Add("C2")
		.Add("C3")
		with .Add("Pos")
			.FormatColumn = "1 pos ``"
			.AllowGroupBy = .F.
			.Position = 0
			.Width = 48
			.AllowSizing = .F.
		endwith
	endwith
	.SortBarVisible = .T.
	.SortBarCaption = "<fgcolor=FF0000>Try to drag the Pos column here."
	.AllowGroupBy = .T.
	with .Items
		h = .AddItem("Item A")
		.DefaultItem = h
		.CellValue(0,1) = "SubItem A.1"
		.DefaultItem = h
		.CellValue(0,2) = "SubItem A.2"
		h = .AddItem("Item A")
		.DefaultItem = h
		.CellValue(0,1) = "SubItem A.1"
		.DefaultItem = h
		.CellValue(0,2) = "SubItem A.2"
		h = .AddItem("Item A")
		.DefaultItem = h
		.CellValue(0,1) = "SubItem A.1"
		.DefaultItem = h
		.CellValue(0,2) = "SubItem A.2"
		h = .AddItem("Item A")
		.DefaultItem = h
		.CellValue(0,1) = "SubItem A.1"
		.DefaultItem = h
		.CellValue(0,2) = "SubItem A.2"
		h = .AddItem("Item B")
		.DefaultItem = h
		.CellValue(0,1) = "SubItem B.1"
		.DefaultItem = h
		.CellValue(0,2) = "SubItem B.2"
		h = .AddItem("Item B")
		.DefaultItem = h
		.CellValue(0,1) = "SubItem B.1"
		.DefaultItem = h
		.CellValue(0,2) = "SubItem B.2"
	endwith
	.EndUpdate
endwith
|
|
2021
|
How can I filter for the type of the bars I have in my chart
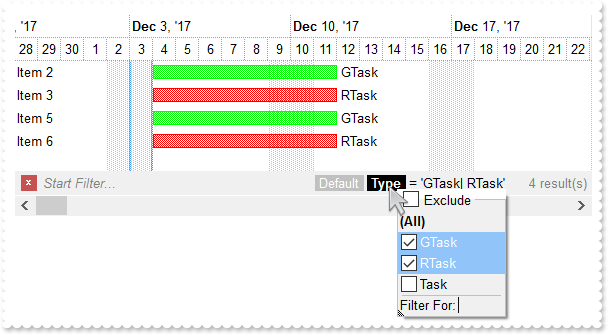
with thisform.G2antt1
	.BeginUpdate
	with .Chart
		.LevelCount = 2
		.FirstVisibleDate = {^2017-11-28}
		.PaneWidth(0) = 0
		with .Bars.Item("Task")
			.Def(3) = "<%=%0%>"
			.Def(4) = 18
		endwith
		with .Bars.Copy("Task","GTask")
			.Def(3) = "<%=%0%>"
			.Def(4) = 18
			.Color = RGB(0,255,0)
		endwith
		with .Bars.Copy("Task","RTask")
			.Def(3) = "<%=%0%>"
			.Def(4) = 18
			.Color = RGB(255,0,0)
		endwith
		.ColumnsFormatLevel = "0"
	endwith
	.OnResizeControl = 129 && OnResizeControlEnum.exDisableSplitter Or OnResizeControlEnum.exResizeChart
	with .Columns.Add("Default")
		.DisplayFilterButton = .T.
		.FilterList = 9504 && FilterListEnum.exShowExclude Or FilterListEnum.exShowFocusItem Or FilterListEnum.exShowCheckBox Or FilterListEnum.exSortItemsAsc
	endwith
	with .Columns.Add("Type")
		.Def(19) = ""
		.Def(18) = 0
		.Visible = .F.
		.DisplayFilterButton = .T.
		.FilterList = 9504 && FilterListEnum.exShowExclude Or FilterListEnum.exShowFocusItem Or FilterListEnum.exShowCheckBox Or FilterListEnum.exSortItemsAsc
	endwith
	with .Items
		.AllowCellValueToItemBar = .T.
		.AddBar(.AddItem("Item 1"),"Task",{^2017-12-4},{^2017-12-12})
		.AddBar(.AddItem("Item 2"),"GTask",{^2017-12-4},{^2017-12-12})
		.AddBar(.AddItem("Item 3"),"RTask",{^2017-12-4},{^2017-12-12})
		.AddBar(.AddItem("Item 4"),"Task",{^2017-12-4},{^2017-12-12})
		.AddBar(.AddItem("Item 5"),"GTask",{^2017-12-4},{^2017-12-12})
		.AddBar(.AddItem("Item 6"),"RTask",{^2017-12-4},{^2017-12-12})
	endwith
	.FilterBarFont = .Font
	.Object.Description(11) = .FormatABC("`<fgcolor=808080> ` + value + ` </fgcolor>`",.Description(11))
	var_s = "(( ( all replace `[<b>` with `<bgcolor=000000><fgcolor=FFFFFF><b> ` replace `</b>]` with ` </b></bgcolor></fgcolor>` replace `[<"
	var_s = var_s + "s>` with `<bgcolor=C0C0C0><fgcolor=FFFFFF> ` replace `</s>]` with ` </fgcolor></bgcolor>` )  + `<r><fgcolor=808080>` + ( matchit"
	var_s = var_s + "emcount < 0 ? ( ( len(value) ? `` : `` ) + `<r>` + abs(matchitemcount + 1) + ` result(s)` ) : (`<r><fgcolor=808080>`+ itemcount "
	var_s = var_s + "+ ` item(s)`) )))"
	.FilterBarCaption = var_s
	.FilterBarPromptVisible = 2579 && FilterBarVisibleEnum.exFilterBarCompact Or FilterBarVisibleEnum.exFilterBarShowCloseIfRequired Or FilterBarVisibleEnum.exFilterBarSingleLine Or FilterBarVisibleEnum.exFilterBarVisible Or FilterBarVisibleEnum.exFilterBarPromptVisible
	with .Columns.Item(1)
		.FilterType = 240
		.Filter = "GTask|RTask"
	endwith
	.ApplyFilter
	.EndUpdate
endwith
|
|
2020
|
How can I display the control's filter bar in the Items section only, as it was displayed before
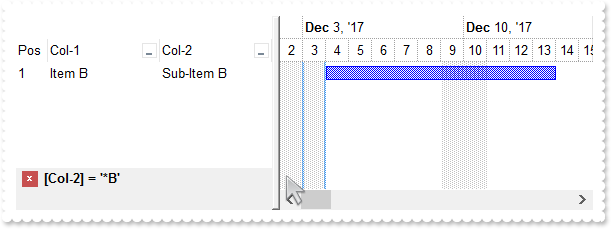
*** AddItem event - Occurs after a new Item has been inserted to Items collection. ***
LPARAMETERS Item
	with thisform.G2antt1
		.Items.AddBar(Item,"Task",{^2017-12-4},{^2017-12-14})
	endwith

with thisform.G2antt1
	.BeginUpdate
	with .Chart
		.LevelCount = 2
		.FirstVisibleDate = {^2017-12-2}
		.PaneWidth(0) = 256
	endwith
	with .Columns.Add("Col-1")
		.DisplayFilterButton = .T.
		.FilterList = 9504 && FilterListEnum.exShowExclude Or FilterListEnum.exShowFocusItem Or FilterListEnum.exShowCheckBox Or FilterListEnum.exSortItemsAsc
	endwith
	with .Columns.Add("Col-2")
		.DisplayFilterButton = .T.
		.FilterList = 9504 && FilterListEnum.exShowExclude Or FilterListEnum.exShowFocusItem Or FilterListEnum.exShowCheckBox Or FilterListEnum.exSortItemsAsc
	endwith
	with .Columns.Add("Pos")
		.AllowSizing = .F.
		.AllowSort = .F.
		.Width = 32
		.FormatColumn = "1 apos ``"
		.Position = 0
	endwith
	with .Items
		.DefaultItem = .AddItem("Item A")
		.CellValue(0,1) = "Sub-Item A"
		.DefaultItem = .AddItem("Item B")
		.CellValue(0,1) = "Sub-Item B"
		.DefaultItem = .AddItem("Item C")
		.CellValue(0,1) = "Sub-Item C"
	endwith
	.FilterBarPromptVisible = 4096
	with .Columns.Item(1)
		.FilterType = 3
		.Filter = "*B"
	endwith
	.ApplyFilter
	.EndUpdate
endwith
|
|
2019
|
FilterBarCaption ALL Keyword ( sample 2, result )
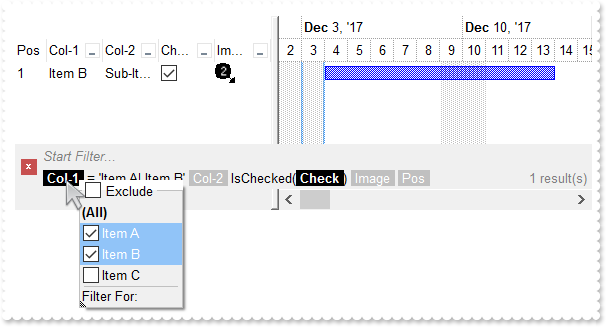
*** AddItem event - Occurs after a new Item has been inserted to Items collection. ***
LPARAMETERS Item
	with thisform.G2antt1
		i = .FormatABC("value + 1",.Items.ItemToIndex(Item))
		.DefaultItem = Item
		.Items.CellImage(0,3) = i
		.Items.AddBar(Item,"Task",{^2017-12-4},{^2017-12-14})
	endwith

with thisform.G2antt1
	.BeginUpdate
	with .Chart
		.LevelCount = 2
		.FirstVisibleDate = {^2017-12-2}
		.PaneWidth(0) = 256
	endwith
	var_s = "gBJJgBAIDAAGAAEAAQhYAf8Pf4hh0QihCJo2AEZjQAjEZFEaIEaEEaAIAkcbk0olUrlktl0vmExmUzmk1m03nE5nU7nk9n0/oFBoVDolFo1HpFJpVLplNp1PqFRqVTql"
	var_s = var_s + "Vq1XrFZrVbrldr1fsFhsVjslls1ntFptVrtltt1vuFxuVzul1u13vF5vV7vl9v1/wGBwWDwmFw2HxGJxWLxmNx0xiFdyOTh8Tf9ZymXx+QytcyNgz8r0OblWjyWds+m0"
	var_s = var_s + "ka1Vf1ta1+r1mos2xrG2xeZ0+a0W0qOx3GO4NV3WeyvD2XJ5XL5nN51aiw+lfSj0gkUkAEllHanHI5j/cHg8EZf7w8vl8j4f/qfEZeB09/vjLAB30+kZQAP/P5/H6/yN"
	var_s = var_s + "AOAEAwCjMBwFAEDwJBMDwLBYAP2/8Hv8/gAGAD8LQs9w/nhDY/oygIA="
	.Images(var_s)
	with .Columns.Add("Col-1")
		.DisplayFilterButton = .T.
		.FilterList = 9504 && FilterListEnum.exShowExclude Or FilterListEnum.exShowFocusItem Or FilterListEnum.exShowCheckBox Or FilterListEnum.exSortItemsAsc
	endwith
	with .Columns.Add("Col-2")
		.DisplayFilterButton = .T.
		.FilterList = 9504 && FilterListEnum.exShowExclude Or FilterListEnum.exShowFocusItem Or FilterListEnum.exShowCheckBox Or FilterListEnum.exSortItemsAsc
	endwith
	with .Columns.Add("Check")
		with .Editor
			.EditType = 19
			.Option(17) = 1
		endwith
		.DisplayFilterButton = .T.
		.DisplayFilterPattern = .F.
		.FilterType = 6
	endwith
	with .Columns.Add("Image")
		.DisplayFilterButton = .T.
		.FilterType = 10
		.FilterList = 9472 && FilterListEnum.exShowExclude Or FilterListEnum.exShowFocusItem Or FilterListEnum.exShowCheckBox
	endwith
	with .Columns.Add("Pos")
		.AllowSizing = .F.
		.AllowSort = .F.
		.Width = 32
		.FormatColumn = "1 apos ``"
		.Position = 0
	endwith
	with .Items
		.DefaultItem = .AddItem("Item A")
		.CellValue(0,1) = "Sub-Item A"
		h = .AddItem("Item B")
		.DefaultItem = h
		.CellValue(0,1) = "Sub-Item B"
		.DefaultItem = h
		.CellState(0,2) = 1
		.DefaultItem = .AddItem("Item C")
		.CellValue(0,1) = "Sub-Item C"
	endwith
	.FilterBarFont = .Font
	.Object.Description(11) = .FormatABC("`<fgcolor=808080> ` + value + ` </fgcolor>`",.Description(11))
	var_s1 = "(( ( all replace `[<b>` with `<bgcolor=000000><fgcolor=FFFFFF><b> ` replace `</b>]` with ` </b></bgcolor></fgcolor>` replace `[<"
	var_s1 = var_s1 + "s>` with `<bgcolor=C0C0C0><fgcolor=FFFFFF> ` replace `</s>]` with ` </fgcolor></bgcolor>` )  + `<r><fgcolor=808080>` + ( matchit"
	var_s1 = var_s1 + "emcount < 0 ? ( ( len(value) ? `` : `` ) + `<r>` + abs(matchitemcount + 1) + ` result(s)` ) : (`<r><fgcolor=808080>`+ itemcount "
	var_s1 = var_s1 + "+ ` item(s)`) )))"
	.FilterBarCaption = var_s1
	.FilterBarPromptVisible = 3 && FilterBarVisibleEnum.exFilterBarVisible Or FilterBarVisibleEnum.exFilterBarPromptVisible
	with .Columns.Item(0)
		.FilterType = 240
		.Filter = "Item A|Item B"
	endwith
	.Columns.Item(2).Filter = 1
	.ApplyFilter
	.EndUpdate
endwith
|
|
2018
|
FilterBarCaption ALL Keyword ( sample 1 )
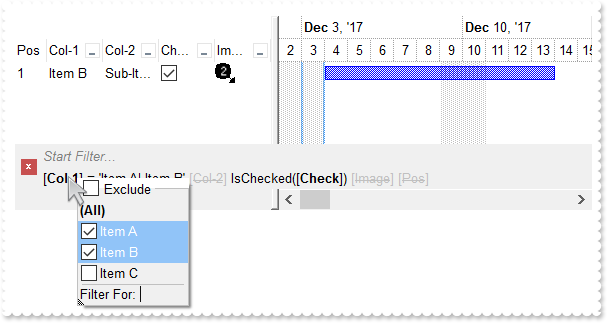
*** AddItem event - Occurs after a new Item has been inserted to Items collection. ***
LPARAMETERS Item
	with thisform.G2antt1
		i = .FormatABC("value + 1",.Items.ItemToIndex(Item))
		.DefaultItem = Item
		.Items.CellImage(0,3) = i
		.Items.AddBar(Item,"Task",{^2017-12-4},{^2017-12-14})
	endwith

with thisform.G2antt1
	.BeginUpdate
	with .Chart
		.LevelCount = 2
		.FirstVisibleDate = {^2017-12-2}
		.PaneWidth(0) = 256
	endwith
	var_s = "gBJJgBAIDAAGAAEAAQhYAf8Pf4hh0QihCJo2AEZjQAjEZFEaIEaEEaAIAkcbk0olUrlktl0vmExmUzmk1m03nE5nU7nk9n0/oFBoVDolFo1HpFJpVLplNp1PqFRqVTql"
	var_s = var_s + "Vq1XrFZrVbrldr1fsFhsVjslls1ntFptVrtltt1vuFxuVzul1u13vF5vV7vl9v1/wGBwWDwmFw2HxGJxWLxmNx0xiFdyOTh8Tf9ZymXx+QytcyNgz8r0OblWjyWds+m0"
	var_s = var_s + "ka1Vf1ta1+r1mos2xrG2xeZ0+a0W0qOx3GO4NV3WeyvD2XJ5XL5nN51aiw+lfSj0gkUkAEllHanHI5j/cHg8EZf7w8vl8j4f/qfEZeB09/vjLAB30+kZQAP/P5/H6/yN"
	var_s = var_s + "AOAEAwCjMBwFAEDwJBMDwLBYAP2/8Hv8/gAGAD8LQs9w/nhDY/oygIA="
	.Images(var_s)
	with .Columns.Add("Col-1")
		.DisplayFilterButton = .T.
		.FilterList = 9504 && FilterListEnum.exShowExclude Or FilterListEnum.exShowFocusItem Or FilterListEnum.exShowCheckBox Or FilterListEnum.exSortItemsAsc
	endwith
	with .Columns.Add("Col-2")
		.DisplayFilterButton = .T.
		.FilterList = 9504 && FilterListEnum.exShowExclude Or FilterListEnum.exShowFocusItem Or FilterListEnum.exShowCheckBox Or FilterListEnum.exSortItemsAsc
	endwith
	with .Columns.Add("Check")
		with .Editor
			.EditType = 19
			.Option(17) = 1
		endwith
		.DisplayFilterButton = .T.
		.DisplayFilterPattern = .F.
		.FilterType = 6
	endwith
	with .Columns.Add("Image")
		.DisplayFilterButton = .T.
		.FilterType = 10
		.FilterList = 9472 && FilterListEnum.exShowExclude Or FilterListEnum.exShowFocusItem Or FilterListEnum.exShowCheckBox
	endwith
	with .Columns.Add("Pos")
		.AllowSizing = .F.
		.AllowSort = .F.
		.Width = 32
		.FormatColumn = "1 apos ``"
		.Position = 0
	endwith
	with .Items
		.DefaultItem = .AddItem("Item A")
		.CellValue(0,1) = "Sub-Item A"
		h = .AddItem("Item B")
		.DefaultItem = h
		.CellValue(0,1) = "Sub-Item B"
		.DefaultItem = h
		.CellState(0,2) = 1
		.DefaultItem = .AddItem("Item C")
		.CellValue(0,1) = "Sub-Item C"
	endwith
	.FilterBarFont = .Font
	.Object.Description(11) = .FormatABC("`<fgcolor=808080> ` + value + ` </fgcolor>`",.Description(11))
	.FilterBarCaption = "all"
	.FilterBarPromptVisible = 3 && FilterBarVisibleEnum.exFilterBarVisible Or FilterBarVisibleEnum.exFilterBarPromptVisible
	with .Columns.Item(0)
		.FilterType = 240
		.Filter = "Item A|Item B"
	endwith
	.Columns.Item(2).Filter = 1
	.ApplyFilter
	.EndUpdate
endwith
|
|
2017
|
FilterBarCaption ALLUI Keyword ( sample 2, result )
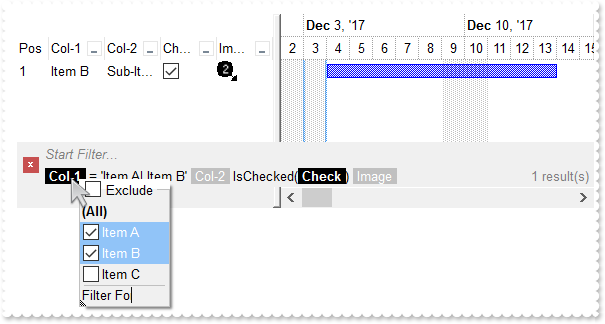
*** AddItem event - Occurs after a new Item has been inserted to Items collection. ***
LPARAMETERS Item
	with thisform.G2antt1
		i = .FormatABC("value + 1",.Items.ItemToIndex(Item))
		.DefaultItem = Item
		.Items.CellImage(0,3) = i
		.Items.AddBar(Item,"Task",{^2017-12-4},{^2017-12-14})
	endwith

with thisform.G2antt1
	.BeginUpdate
	with .Chart
		.LevelCount = 2
		.FirstVisibleDate = {^2017-12-2}
		.PaneWidth(0) = 256
	endwith
	var_s = "gBJJgBAIDAAGAAEAAQhYAf8Pf4hh0QihCJo2AEZjQAjEZFEaIEaEEaAIAkcbk0olUrlktl0vmExmUzmk1m03nE5nU7nk9n0/oFBoVDolFo1HpFJpVLplNp1PqFRqVTql"
	var_s = var_s + "Vq1XrFZrVbrldr1fsFhsVjslls1ntFptVrtltt1vuFxuVzul1u13vF5vV7vl9v1/wGBwWDwmFw2HxGJxWLxmNx0xiFdyOTh8Tf9ZymXx+QytcyNgz8r0OblWjyWds+m0"
	var_s = var_s + "ka1Vf1ta1+r1mos2xrG2xeZ0+a0W0qOx3GO4NV3WeyvD2XJ5XL5nN51aiw+lfSj0gkUkAEllHanHI5j/cHg8EZf7w8vl8j4f/qfEZeB09/vjLAB30+kZQAP/P5/H6/yN"
	var_s = var_s + "AOAEAwCjMBwFAEDwJBMDwLBYAP2/8Hv8/gAGAD8LQs9w/nhDY/oygIA="
	.Images(var_s)
	with .Columns.Add("Col-1")
		.DisplayFilterButton = .T.
		.FilterList = 9504 && FilterListEnum.exShowExclude Or FilterListEnum.exShowFocusItem Or FilterListEnum.exShowCheckBox Or FilterListEnum.exSortItemsAsc
	endwith
	with .Columns.Add("Col-2")
		.DisplayFilterButton = .T.
		.FilterList = 9504 && FilterListEnum.exShowExclude Or FilterListEnum.exShowFocusItem Or FilterListEnum.exShowCheckBox Or FilterListEnum.exSortItemsAsc
	endwith
	with .Columns.Add("Check")
		with .Editor
			.EditType = 19
			.Option(17) = 1
		endwith
		.DisplayFilterButton = .T.
		.DisplayFilterPattern = .F.
		.FilterType = 6
	endwith
	with .Columns.Add("Image")
		.DisplayFilterButton = .T.
		.FilterType = 10
		.FilterList = 9472 && FilterListEnum.exShowExclude Or FilterListEnum.exShowFocusItem Or FilterListEnum.exShowCheckBox
	endwith
	with .Columns.Add("Pos")
		.AllowSizing = .F.
		.AllowSort = .F.
		.Width = 32
		.FormatColumn = "1 apos ``"
		.Position = 0
	endwith
	with .Items
		.DefaultItem = .AddItem("Item A")
		.CellValue(0,1) = "Sub-Item A"
		h = .AddItem("Item B")
		.DefaultItem = h
		.CellValue(0,1) = "Sub-Item B"
		.DefaultItem = h
		.CellState(0,2) = 1
		.DefaultItem = .AddItem("Item C")
		.CellValue(0,1) = "Sub-Item C"
	endwith
	.FilterBarFont = .Font
	.Object.Description(11) = .FormatABC("`<fgcolor=808080> ` + value + ` </fgcolor>`",.Description(11))
	var_s1 = "(( ( allui replace `[<b>` with `<bgcolor=000000><fgcolor=FFFFFF><b> ` replace `</b>]` with ` </b></bgcolor></fgcolor>` replace `"
	var_s1 = var_s1 + "[<s>` with `<bgcolor=C0C0C0><fgcolor=FFFFFF> ` replace `</s>]` with ` </fgcolor></bgcolor>` )  + `<r><fgcolor=808080>` + ( match"
	var_s1 = var_s1 + "itemcount < 0 ? ( ( len(value) ? `` : `` ) + `<r>` + abs(matchitemcount + 1) + ` result(s)` ) : (`<r><fgcolor=808080>`+ itemcoun"
	var_s1 = var_s1 + "t + ` item(s)`) )))"
	.FilterBarCaption = var_s1
	.FilterBarPromptVisible = 3 && FilterBarVisibleEnum.exFilterBarVisible Or FilterBarVisibleEnum.exFilterBarPromptVisible
	with .Columns.Item(0)
		.FilterType = 240
		.Filter = "Item A|Item B"
	endwith
	.Columns.Item(2).Filter = 1
	.ApplyFilter
	.EndUpdate
endwith
|
|
2016
|
FilterBarCaption ALLUI Keyword ( sample 1 )
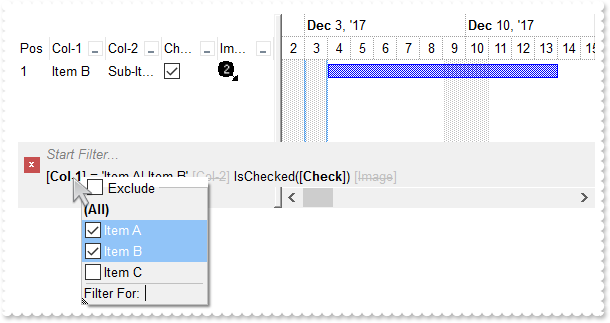
*** AddItem event - Occurs after a new Item has been inserted to Items collection. ***
LPARAMETERS Item
	with thisform.G2antt1
		i = .FormatABC("value + 1",.Items.ItemToIndex(Item))
		.DefaultItem = Item
		.Items.CellImage(0,3) = i
		.Items.AddBar(Item,"Task",{^2017-12-4},{^2017-12-14})
	endwith

with thisform.G2antt1
	.BeginUpdate
	with .Chart
		.LevelCount = 2
		.FirstVisibleDate = {^2017-12-2}
		.PaneWidth(0) = 256
	endwith
	var_s = "gBJJgBAIDAAGAAEAAQhYAf8Pf4hh0QihCJo2AEZjQAjEZFEaIEaEEaAIAkcbk0olUrlktl0vmExmUzmk1m03nE5nU7nk9n0/oFBoVDolFo1HpFJpVLplNp1PqFRqVTql"
	var_s = var_s + "Vq1XrFZrVbrldr1fsFhsVjslls1ntFptVrtltt1vuFxuVzul1u13vF5vV7vl9v1/wGBwWDwmFw2HxGJxWLxmNx0xiFdyOTh8Tf9ZymXx+QytcyNgz8r0OblWjyWds+m0"
	var_s = var_s + "ka1Vf1ta1+r1mos2xrG2xeZ0+a0W0qOx3GO4NV3WeyvD2XJ5XL5nN51aiw+lfSj0gkUkAEllHanHI5j/cHg8EZf7w8vl8j4f/qfEZeB09/vjLAB30+kZQAP/P5/H6/yN"
	var_s = var_s + "AOAEAwCjMBwFAEDwJBMDwLBYAP2/8Hv8/gAGAD8LQs9w/nhDY/oygIA="
	.Images(var_s)
	with .Columns.Add("Col-1")
		.DisplayFilterButton = .T.
		.FilterList = 9504 && FilterListEnum.exShowExclude Or FilterListEnum.exShowFocusItem Or FilterListEnum.exShowCheckBox Or FilterListEnum.exSortItemsAsc
	endwith
	with .Columns.Add("Col-2")
		.DisplayFilterButton = .T.
		.FilterList = 9504 && FilterListEnum.exShowExclude Or FilterListEnum.exShowFocusItem Or FilterListEnum.exShowCheckBox Or FilterListEnum.exSortItemsAsc
	endwith
	with .Columns.Add("Check")
		with .Editor
			.EditType = 19
			.Option(17) = 1
		endwith
		.DisplayFilterButton = .T.
		.DisplayFilterPattern = .F.
		.FilterType = 6
	endwith
	with .Columns.Add("Image")
		.DisplayFilterButton = .T.
		.FilterType = 10
		.FilterList = 9472 && FilterListEnum.exShowExclude Or FilterListEnum.exShowFocusItem Or FilterListEnum.exShowCheckBox
	endwith
	with .Columns.Add("Pos")
		.AllowSizing = .F.
		.AllowSort = .F.
		.Width = 32
		.FormatColumn = "1 apos ``"
		.Position = 0
	endwith
	with .Items
		.DefaultItem = .AddItem("Item A")
		.CellValue(0,1) = "Sub-Item A"
		h = .AddItem("Item B")
		.DefaultItem = h
		.CellValue(0,1) = "Sub-Item B"
		.DefaultItem = h
		.CellState(0,2) = 1
		.DefaultItem = .AddItem("Item C")
		.CellValue(0,1) = "Sub-Item C"
	endwith
	.FilterBarFont = .Font
	.Object.Description(11) = .FormatABC("`<fgcolor=808080> ` + value + ` </fgcolor>`",.Description(11))
	.FilterBarCaption = "allui"
	.FilterBarPromptVisible = 3 && FilterBarVisibleEnum.exFilterBarVisible Or FilterBarVisibleEnum.exFilterBarPromptVisible
	with .Columns.Item(0)
		.FilterType = 240
		.Filter = "Item A|Item B"
	endwith
	.Columns.Item(2).Filter = 1
	.ApplyFilter
	.EndUpdate
endwith
|
|
2015
|
FilterBarCaption AVAILABLE Keyword ( sample 2, result )
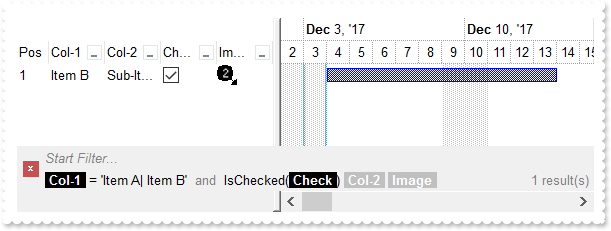
*** AddItem event - Occurs after a new Item has been inserted to Items collection. ***
LPARAMETERS Item
	with thisform.G2antt1
		i = .FormatABC("value + 1",.Items.ItemToIndex(Item))
		.DefaultItem = Item
		.Items.CellImage(0,3) = i
		.Items.AddBar(Item,"Task",{^2017-12-4},{^2017-12-14})
	endwith

with thisform.G2antt1
	.BeginUpdate
	with .Chart
		.LevelCount = 2
		.FirstVisibleDate = {^2017-12-2}
		.PaneWidth(0) = 256
	endwith
	var_s = "gBJJgBAIDAAGAAEAAQhYAf8Pf4hh0QihCJo2AEZjQAjEZFEaIEaEEaAIAkcbk0olUrlktl0vmExmUzmk1m03nE5nU7nk9n0/oFBoVDolFo1HpFJpVLplNp1PqFRqVTql"
	var_s = var_s + "Vq1XrFZrVbrldr1fsFhsVjslls1ntFptVrtltt1vuFxuVzul1u13vF5vV7vl9v1/wGBwWDwmFw2HxGJxWLxmNx0xiFdyOTh8Tf9ZymXx+QytcyNgz8r0OblWjyWds+m0"
	var_s = var_s + "ka1Vf1ta1+r1mos2xrG2xeZ0+a0W0qOx3GO4NV3WeyvD2XJ5XL5nN51aiw+lfSj0gkUkAEllHanHI5j/cHg8EZf7w8vl8j4f/qfEZeB09/vjLAB30+kZQAP/P5/H6/yN"
	var_s = var_s + "AOAEAwCjMBwFAEDwJBMDwLBYAP2/8Hv8/gAGAD8LQs9w/nhDY/oygIA="
	.Images(var_s)
	with .Columns.Add("Col-1")
		.DisplayFilterButton = .T.
		.FilterList = 9504 && FilterListEnum.exShowExclude Or FilterListEnum.exShowFocusItem Or FilterListEnum.exShowCheckBox Or FilterListEnum.exSortItemsAsc
	endwith
	with .Columns.Add("Col-2")
		.DisplayFilterButton = .T.
		.FilterList = 9504 && FilterListEnum.exShowExclude Or FilterListEnum.exShowFocusItem Or FilterListEnum.exShowCheckBox Or FilterListEnum.exSortItemsAsc
	endwith
	with .Columns.Add("Check")
		with .Editor
			.EditType = 19
			.Option(17) = 1
		endwith
		.DisplayFilterButton = .T.
		.DisplayFilterPattern = .F.
		.FilterType = 6
	endwith
	with .Columns.Add("Image")
		.DisplayFilterButton = .T.
		.FilterType = 10
		.FilterList = 9472 && FilterListEnum.exShowExclude Or FilterListEnum.exShowFocusItem Or FilterListEnum.exShowCheckBox
	endwith
	with .Columns.Add("Pos")
		.AllowSizing = .F.
		.AllowSort = .F.
		.Width = 32
		.FormatColumn = "1 apos ``"
		.Position = 0
	endwith
	with .Items
		.DefaultItem = .AddItem("Item A")
		.CellValue(0,1) = "Sub-Item A"
		h = .AddItem("Item B")
		.DefaultItem = h
		.CellValue(0,1) = "Sub-Item B"
		.DefaultItem = h
		.CellState(0,2) = 1
		.DefaultItem = .AddItem("Item C")
		.CellValue(0,1) = "Sub-Item C"
	endwith
	.FilterBarFont = .Font
	.Object.Description(11) = .FormatABC("`<fgcolor=808080> ` + value + ` </fgcolor>`",.Description(11))
	var_s1 = "(( ( value replace `[` with `<bgcolor=000000><fgcolor=FFFFFF><b> ` replace `]` with ` </b></bgcolor></fgcolor>` ) + ` ` + ( avai"
	var_s1 = var_s1 + "lable replace `[` with `<bgcolor=C0C0C0><fgcolor=FFFFFF><b> ` replace `]` with ` </b></bgcolor></fgcolor>` replace `<s>` with ``"
	var_s1 = var_s1 + " replace `</s>` with `` ) + `<fgcolor=808080>` + ( matchitemcount < 0 ? ( ( len(value) ? `` : `` ) + `<r>` + abs(matchitemcount "
	var_s1 = var_s1 + "+ 1) + ` result(s)` ) : (`<r><fgcolor=808080>`+ itemcount + ` item(s)`) )))"
	.FilterBarCaption = var_s1
	.FilterBarPromptVisible = 3 && FilterBarVisibleEnum.exFilterBarVisible Or FilterBarVisibleEnum.exFilterBarPromptVisible
	with .Columns.Item(0)
		.FilterType = 240
		.Filter = "Item A|Item B"
	endwith
	.Columns.Item(2).Filter = 1
	.ApplyFilter
	.EndUpdate
endwith
|
|
2014
|
FilterBarCaption AVAILABLE Keyword ( sample 1 )
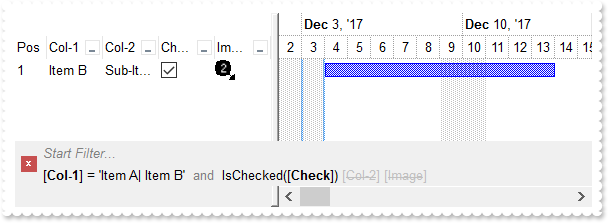
*** AddItem event - Occurs after a new Item has been inserted to Items collection. ***
LPARAMETERS Item
	with thisform.G2antt1
		i = .FormatABC("value + 1",.Items.ItemToIndex(Item))
		.DefaultItem = Item
		.Items.CellImage(0,3) = i
		.Items.AddBar(Item,"Task",{^2017-12-4},{^2017-12-14})
	endwith

with thisform.G2antt1
	.BeginUpdate
	with .Chart
		.LevelCount = 2
		.FirstVisibleDate = {^2017-12-2}
		.PaneWidth(0) = 256
	endwith
	var_s = "gBJJgBAIDAAGAAEAAQhYAf8Pf4hh0QihCJo2AEZjQAjEZFEaIEaEEaAIAkcbk0olUrlktl0vmExmUzmk1m03nE5nU7nk9n0/oFBoVDolFo1HpFJpVLplNp1PqFRqVTql"
	var_s = var_s + "Vq1XrFZrVbrldr1fsFhsVjslls1ntFptVrtltt1vuFxuVzul1u13vF5vV7vl9v1/wGBwWDwmFw2HxGJxWLxmNx0xiFdyOTh8Tf9ZymXx+QytcyNgz8r0OblWjyWds+m0"
	var_s = var_s + "ka1Vf1ta1+r1mos2xrG2xeZ0+a0W0qOx3GO4NV3WeyvD2XJ5XL5nN51aiw+lfSj0gkUkAEllHanHI5j/cHg8EZf7w8vl8j4f/qfEZeB09/vjLAB30+kZQAP/P5/H6/yN"
	var_s = var_s + "AOAEAwCjMBwFAEDwJBMDwLBYAP2/8Hv8/gAGAD8LQs9w/nhDY/oygIA="
	.Images(var_s)
	with .Columns.Add("Col-1")
		.DisplayFilterButton = .T.
		.FilterList = 9504 && FilterListEnum.exShowExclude Or FilterListEnum.exShowFocusItem Or FilterListEnum.exShowCheckBox Or FilterListEnum.exSortItemsAsc
	endwith
	with .Columns.Add("Col-2")
		.DisplayFilterButton = .T.
		.FilterList = 9504 && FilterListEnum.exShowExclude Or FilterListEnum.exShowFocusItem Or FilterListEnum.exShowCheckBox Or FilterListEnum.exSortItemsAsc
	endwith
	with .Columns.Add("Check")
		with .Editor
			.EditType = 19
			.Option(17) = 1
		endwith
		.DisplayFilterButton = .T.
		.DisplayFilterPattern = .F.
		.FilterType = 6
	endwith
	with .Columns.Add("Image")
		.DisplayFilterButton = .T.
		.FilterType = 10
		.FilterList = 9472 && FilterListEnum.exShowExclude Or FilterListEnum.exShowFocusItem Or FilterListEnum.exShowCheckBox
	endwith
	with .Columns.Add("Pos")
		.AllowSizing = .F.
		.AllowSort = .F.
		.Width = 32
		.FormatColumn = "1 apos ``"
		.Position = 0
	endwith
	with .Items
		.DefaultItem = .AddItem("Item A")
		.CellValue(0,1) = "Sub-Item A"
		h = .AddItem("Item B")
		.DefaultItem = h
		.CellValue(0,1) = "Sub-Item B"
		.DefaultItem = h
		.CellState(0,2) = 1
		.DefaultItem = .AddItem("Item C")
		.CellValue(0,1) = "Sub-Item C"
	endwith
	.FilterBarFont = .Font
	.Object.Description(11) = .FormatABC("`<fgcolor=808080> ` + value + ` </fgcolor>`",.Description(11))
	.FilterBarCaption = "value + ` ` + available"
	.FilterBarPromptVisible = 3 && FilterBarVisibleEnum.exFilterBarVisible Or FilterBarVisibleEnum.exFilterBarPromptVisible
	with .Columns.Item(0)
		.FilterType = 240
		.Filter = "Item A|Item B"
	endwith
	.Columns.Item(2).Filter = 1
	.ApplyFilter
	.EndUpdate
endwith
|
|
2013
|
Is it possible to somehow highlight the column's name different than its filter value in the control's filter bar ( sample 3, results )
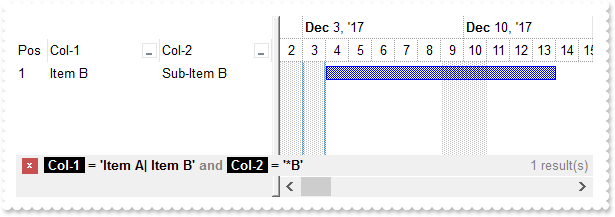
*** AddItem event - Occurs after a new Item has been inserted to Items collection. ***
LPARAMETERS Item
	with thisform.G2antt1
		.Items.AddBar(Item,"Task",{^2017-12-4},{^2017-12-14})
	endwith

with thisform.G2antt1
	.BeginUpdate
	with .Chart
		.LevelCount = 2
		.FirstVisibleDate = {^2017-12-2}
		.PaneWidth(0) = 256
	endwith
	with .Columns.Add("Col-1")
		.DisplayFilterButton = .T.
		.FilterList = 9504 && FilterListEnum.exShowExclude Or FilterListEnum.exShowFocusItem Or FilterListEnum.exShowCheckBox Or FilterListEnum.exSortItemsAsc
	endwith
	with .Columns.Add("Col-2")
		.DisplayFilterButton = .T.
		.FilterList = 9504 && FilterListEnum.exShowExclude Or FilterListEnum.exShowFocusItem Or FilterListEnum.exShowCheckBox Or FilterListEnum.exSortItemsAsc
	endwith
	with .Columns.Add("Pos")
		.AllowSizing = .F.
		.AllowSort = .F.
		.Width = 32
		.FormatColumn = "1 apos ``"
		.Position = 0
	endwith
	with .Items
		.DefaultItem = .AddItem("Item A")
		.CellValue(0,1) = "Sub-Item A"
		.DefaultItem = .AddItem("Item B")
		.CellValue(0,1) = "Sub-Item B"
		.DefaultItem = .AddItem("Item C")
		.CellValue(0,1) = "Sub-Item C"
	endwith
	.FilterBarFont = .Font
	.Object.Description(11) = .FormatABC("`<fgcolor=808080>` + value + `</fgcolor>`",.Description(11))
	var_s = "(`<b>` + value + `</b><fgcolor=808080>` + ( matchitemcount < 0 ? ( ( len(value) ? `` : `` ) + `<r>` + abs(matchitemcount + 1) + "
	var_s = var_s + "` result(s)` ) : (`<fgcolor=808080>`+ itemcount + ` item(s)`) )) replace `[` with `<bgcolor=000000><fgcolor=FFFFFF><b> ` replace"
	var_s = var_s + " `]` with ` </b></bgcolor></fgcolor>`"
	.FilterBarCaption = var_s
	.FilterBarPromptVisible = 256
	with .Columns.Item(0)
		.FilterType = 240
		.Filter = "Item A|Item B"
	endwith
	with .Columns.Item(1)
		.FilterType = 3
		.Filter = "*B"
	endwith
	.ApplyFilter
	.EndUpdate
endwith
|
|
2012
|
Is it possible to somehow highlight the column's name different than its filter value in the control's filter bar ( sample 2 )
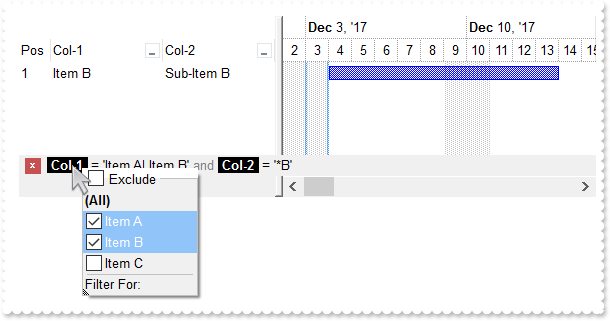
*** AddItem event - Occurs after a new Item has been inserted to Items collection. ***
LPARAMETERS Item
	with thisform.G2antt1
		.Items.AddBar(Item,"Task",{^2017-12-4},{^2017-12-14})
	endwith

with thisform.G2antt1
	.BeginUpdate
	with .Chart
		.LevelCount = 2
		.FirstVisibleDate = {^2017-12-2}
		.PaneWidth(0) = 256
	endwith
	with .Columns.Add("Col-1")
		.DisplayFilterButton = .T.
		.FilterList = 9504 && FilterListEnum.exShowExclude Or FilterListEnum.exShowFocusItem Or FilterListEnum.exShowCheckBox Or FilterListEnum.exSortItemsAsc
	endwith
	with .Columns.Add("Col-2")
		.DisplayFilterButton = .T.
		.FilterList = 9504 && FilterListEnum.exShowExclude Or FilterListEnum.exShowFocusItem Or FilterListEnum.exShowCheckBox Or FilterListEnum.exSortItemsAsc
	endwith
	with .Columns.Add("Pos")
		.AllowSizing = .F.
		.AllowSort = .F.
		.Width = 32
		.FormatColumn = "1 apos ``"
		.Position = 0
	endwith
	with .Items
		.DefaultItem = .AddItem("Item A")
		.CellValue(0,1) = "Sub-Item A"
		.DefaultItem = .AddItem("Item B")
		.CellValue(0,1) = "Sub-Item B"
		.DefaultItem = .AddItem("Item C")
		.CellValue(0,1) = "Sub-Item C"
	endwith
	.FilterBarFont = .Font
	.Object.Description(11) = .FormatABC("`<fgcolor=808080>` + value + `</fgcolor>`",.Description(11))
	.FilterBarCaption = "value replace `[` with `<bgcolor=000000><fgcolor=FFFFFF><b> ` replace `]` with ` </b></bgcolor></fgcolor>`"
	.FilterBarPromptVisible = 256
	with .Columns.Item(0)
		.FilterType = 240
		.Filter = "Item A|Item B"
	endwith
	with .Columns.Item(1)
		.FilterType = 3
		.Filter = "*B"
	endwith
	.ApplyFilter
	.EndUpdate
endwith
|
|
2011
|
Is it possible to somehow highlight the column's name different than its filter value in the control's filter bar ( sample 1 )
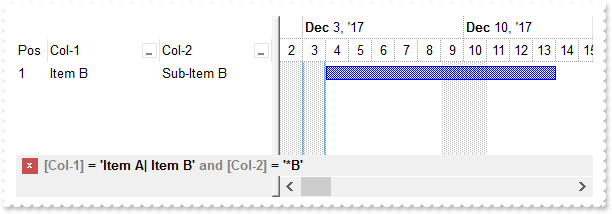
*** AddItem event - Occurs after a new Item has been inserted to Items collection. ***
LPARAMETERS Item
	with thisform.G2antt1
		.Items.AddBar(Item,"Task",{^2017-12-4},{^2017-12-14})
	endwith

with thisform.G2antt1
	.BeginUpdate
	with .Chart
		.LevelCount = 2
		.FirstVisibleDate = {^2017-12-2}
		.PaneWidth(0) = 256
	endwith
	with .Columns.Add("Col-1")
		.DisplayFilterButton = .T.
		.FilterList = 9504 && FilterListEnum.exShowExclude Or FilterListEnum.exShowFocusItem Or FilterListEnum.exShowCheckBox Or FilterListEnum.exSortItemsAsc
	endwith
	with .Columns.Add("Col-2")
		.DisplayFilterButton = .T.
		.FilterList = 9504 && FilterListEnum.exShowExclude Or FilterListEnum.exShowFocusItem Or FilterListEnum.exShowCheckBox Or FilterListEnum.exSortItemsAsc
	endwith
	with .Columns.Add("Pos")
		.AllowSizing = .F.
		.AllowSort = .F.
		.Width = 32
		.FormatColumn = "1 apos ``"
		.Position = 0
	endwith
	with .Items
		.DefaultItem = .AddItem("Item A")
		.CellValue(0,1) = "Sub-Item A"
		.DefaultItem = .AddItem("Item B")
		.CellValue(0,1) = "Sub-Item B"
		.DefaultItem = .AddItem("Item C")
		.CellValue(0,1) = "Sub-Item C"
	endwith
	.Object.Description(11) = .FormatABC("`<fgcolor=808080>` + value + `</fgcolor>`",.Description(11))
	.FilterBarCaption = "value replace `[` with `<fgcolor=808080>[` replace `]` with `]</fgcolor>`"
	.FilterBarPromptVisible = 256
	with .Columns.Item(0)
		.FilterType = 240
		.Filter = "Item A|Item B"
	endwith
	with .Columns.Item(1)
		.FilterType = 3
		.Filter = "*B"
	endwith
	.ApplyFilter
	.EndUpdate
endwith
|
|
2010
|
Is it possible to automatically displays the control's filter label to the right
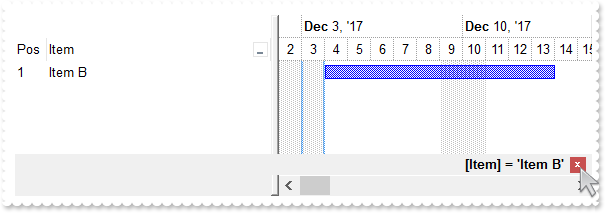
*** AddItem event - Occurs after a new Item has been inserted to Items collection. ***
LPARAMETERS Item
	with thisform.G2antt1
		.Items.AddBar(Item,"Task",{^2017-12-4},{^2017-12-14})
	endwith

with thisform.G2antt1
	.BeginUpdate
	with .Chart
		.LevelCount = 2
		.FirstVisibleDate = {^2017-12-2}
		.PaneWidth(0) = 256
	endwith
	with .Columns.Add("Item")
		.DisplayFilterButton = .T.
		.FilterList = 9504 && FilterListEnum.exShowExclude Or FilterListEnum.exShowFocusItem Or FilterListEnum.exShowCheckBox Or FilterListEnum.exSortItemsAsc
	endwith
	with .Columns.Add("Pos")
		.AllowSizing = .F.
		.AllowSort = .F.
		.Width = 32
		.FormatColumn = "1 apos ``"
		.Position = 0
	endwith
	with .Items
		.AddItem("Item A")
		.AddItem("Item B")
		.AddItem("Item C")
	endwith
	.FilterBarCaption = "`<r>` + value"
	.FilterBarPromptVisible = 1280 && FilterBarVisibleEnum.exFilterBarShowCloseOnRight Or FilterBarVisibleEnum.exFilterBarToggle
	with .Columns.Item(0)
		.FilterType = 240
		.Filter = "Item B"
	endwith
	.ApplyFilter
	.EndUpdate
endwith
|
|
2009
|
How can I get the number of results/items being shown in the control's filter bar (sample 4)
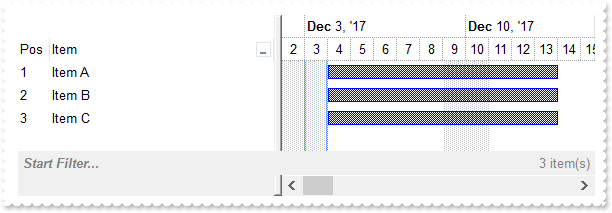
*** AddItem event - Occurs after a new Item has been inserted to Items collection. ***
LPARAMETERS Item
	with thisform.G2antt1
		.Items.AddBar(Item,"Task",{^2017-12-4},{^2017-12-14})
	endwith

with thisform.G2antt1
	.BeginUpdate
	with .Chart
		.LevelCount = 2
		.FirstVisibleDate = {^2017-12-2}
		.PaneWidth(0) = 256
	endwith
	with .Columns.Add("Item")
		.DisplayFilterButton = .T.
		.FilterList = 9504 && FilterListEnum.exShowExclude Or FilterListEnum.exShowFocusItem Or FilterListEnum.exShowCheckBox Or FilterListEnum.exSortItemsAsc
	endwith
	with .Columns.Add("Pos")
		.AllowSizing = .F.
		.AllowSort = .F.
		.Width = 32
		.FormatColumn = "1 apos ``"
		.Position = 0
	endwith
	with .Items
		.AddItem("Item A")
		.AddItem("Item B")
		.AddItem("Item C")
	endwith
	.FilterBarFont = .Font
	.FilterBarPrompt = .FormatABC("`<b>` + value",.FilterBarPrompt)
	var_s = "`<b><r>` + value + `</b><fgcolor=808080>` + ( matchitemcount < 0 ? ( ( len(value) ? `<br>` : `` ) + `<r>` + abs(matchitemcount +"
	var_s = var_s + " 1) + ` result(s)` ) : (`<fgcolor=808080>`+ itemcount + ` item(s)`) )"
	.FilterBarCaption = var_s
	.FilterBarPromptVisible = 3591 && FilterBarVisibleEnum.exFilterBarCompact Or FilterBarVisibleEnum.exFilterBarShowCloseOnRight Or FilterBarVisibleEnum.exFilterBarShowCloseIfRequired Or FilterBarVisibleEnum.exFilterBarCaptionVisible Or FilterBarVisibleEnum.exFilterBarVisible Or FilterBarVisibleEnum.exFilterBarPromptVisible
	.EndUpdate
endwith
|
|
2008
|
How can I get the number of results being shown in the control's filter bar (sample 3)
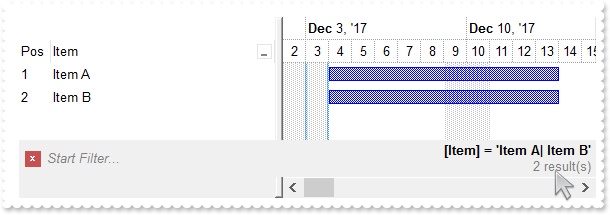
*** AddItem event - Occurs after a new Item has been inserted to Items collection. ***
LPARAMETERS Item
	with thisform.G2antt1
		.Items.AddBar(Item,"Task",{^2017-12-4},{^2017-12-14})
	endwith

with thisform.G2antt1
	.BeginUpdate
	with .Chart
		.LevelCount = 2
		.FirstVisibleDate = {^2017-12-2}
		.PaneWidth(0) = 256
	endwith
	.Columns.Add("Item").DisplayFilterButton = .T.
	with .Columns.Add("Pos")
		.AllowSizing = .F.
		.AllowSort = .F.
		.Width = 32
		.FormatColumn = "1 apos ``"
		.Position = 0
	endwith
	with .Items
		.AddItem("Item A")
		.AddItem("Item B")
		.AddItem("Item C")
	endwith
	.FilterBarFont = .Font
	var_s = "`<b><r>` + value + `</b><fgcolor=808080>` + ( matchitemcount < 0 ? ( ( len(value) ? `<br>` : `` ) + `<r>` + abs(matchitemcount +"
	var_s = var_s + " 1) + ` result(s)` ) : ``)"
	.FilterBarCaption = var_s
	.FilterBarPromptVisible = 2055 && FilterBarVisibleEnum.exFilterBarCompact Or FilterBarVisibleEnum.exFilterBarCaptionVisible Or FilterBarVisibleEnum.exFilterBarVisible Or FilterBarVisibleEnum.exFilterBarPromptVisible
	with .Columns.Item(0)
		.FilterType = 240
		.Filter = "Item A|Item B"
	endwith
	.ApplyFilter
	.EndUpdate
endwith
|
|
2007
|
How can I get the number of results being shown in the control's filter bar (sample 2, compact)
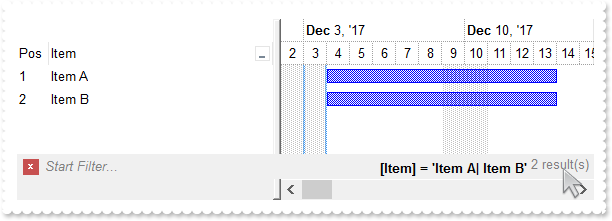
*** AddItem event - Occurs after a new Item has been inserted to Items collection. ***
LPARAMETERS Item
	with thisform.G2antt1
		.Items.AddBar(Item,"Task",{^2017-12-4},{^2017-12-14})
	endwith

with thisform.G2antt1
	.BeginUpdate
	with .Chart
		.LevelCount = 2
		.FirstVisibleDate = {^2017-12-2}
		.PaneWidth(0) = 256
	endwith
	.Columns.Add("Item").DisplayFilterButton = .T.
	with .Columns.Add("Pos")
		.AllowSizing = .F.
		.AllowSort = .F.
		.Width = 32
		.FormatColumn = "1 apos ``"
		.Position = 0
	endwith
	with .Items
		.AddItem("Item A")
		.AddItem("Item B")
		.AddItem("Item C")
	endwith
	.FilterBarFont = .Font
	.FilterBarCaption = "`<b><r>` + value + `</b><fgcolor=808080>` + ( matchitemcount < 0 ? `<off -4> ` + abs(matchitemcount + 1) + ` result(s)` : ``)"
	.FilterBarPromptVisible = 2071 && FilterBarVisibleEnum.exFilterBarCompact Or FilterBarVisibleEnum.exFilterBarSingleLine Or FilterBarVisibleEnum.exFilterBarCaptionVisible Or FilterBarVisibleEnum.exFilterBarVisible Or FilterBarVisibleEnum.exFilterBarPromptVisible
	with .Columns.Item(0)
		.FilterType = 240
		.Filter = "Item A|Item B"
	endwith
	.ApplyFilter
	.EndUpdate
endwith
|
|
2006
|
How can I get the number of results being shown in the control's filter bar (sample 1)
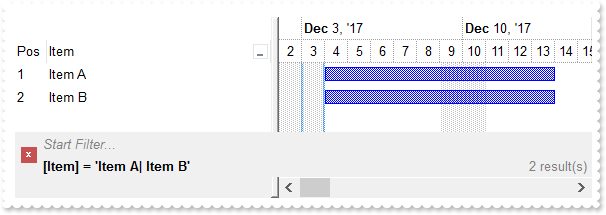
*** AddItem event - Occurs after a new Item has been inserted to Items collection. ***
LPARAMETERS Item
	with thisform.G2antt1
		.Items.AddBar(Item,"Task",{^2017-12-4},{^2017-12-14})
	endwith

with thisform.G2antt1
	.BeginUpdate
	with .Chart
		.LevelCount = 2
		.FirstVisibleDate = {^2017-12-2}
		.PaneWidth(0) = 256
	endwith
	.Columns.Add("Item").DisplayFilterButton = .T.
	with .Columns.Add("Pos")
		.AllowSizing = .F.
		.AllowSort = .F.
		.Width = 32
		.FormatColumn = "1 apos ``"
		.Position = 0
	endwith
	with .Items
		.AddItem("Item A")
		.AddItem("Item B")
		.AddItem("Item C")
	endwith
	.FilterBarFont = .Font
	.FilterBarCaption = "`<b>` + value + `</b><r><fgcolor=808080>` + ( matchitemcount < 0 ? abs(matchitemcount + 1) + ` result(s)` : ``)"
	.FilterBarPromptVisible = 7 && FilterBarVisibleEnum.exFilterBarCaptionVisible Or FilterBarVisibleEnum.exFilterBarVisible Or FilterBarVisibleEnum.exFilterBarPromptVisible
	with .Columns.Item(0)
		.FilterType = 240
		.Filter = "Item A|Item B"
	endwith
	.ApplyFilter
	.EndUpdate
endwith
|
|
2005
|
FilterBarCaption Predefined Keywords
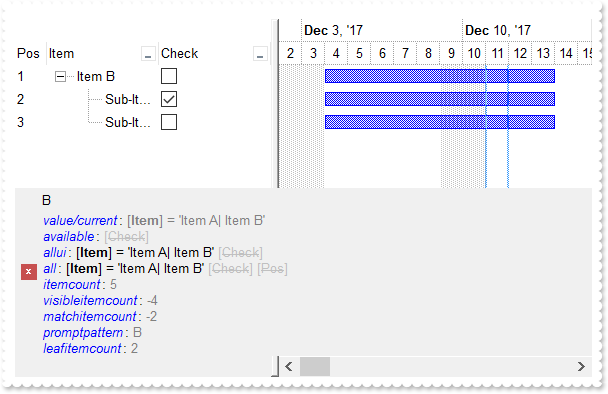
*** AddItem event - Occurs after a new Item has been inserted to Items collection. ***
LPARAMETERS Item
	with thisform.G2antt1
		.Items.AddBar(Item,"Task",{^2017-12-4},{^2017-12-14})
	endwith

*** AfterExpandItem event - Fired after an item is expanded (collapsed). ***
LPARAMETERS Item
	with thisform.G2antt1
		.Refresh
	endwith

with thisform.G2antt1
	.BeginUpdate
	with .Chart
		.LevelCount = 2
		.FirstVisibleDate = {^2017-12-2}
		.PaneWidth(0) = 256
	endwith
	.LinesAtRoot = -1
	.Columns.Add("Item").DisplayFilterButton = .T.
	with .Columns.Add("Check")
		with .Editor
			.EditType = 19
			.Option(17) = 1
		endwith
		.DisplayFilterButton = .T.
		.DisplayFilterPattern = .F.
		.FilterType = 6
	endwith
	with .Columns.Add("Pos")
		.AllowSizing = .F.
		.AllowSort = .F.
		.Width = 32
		.FormatColumn = "1 apos ``"
		.Position = 0
	endwith
	with .Items
		.AddItem("Item A")
		h = .AddItem("Item B")
		.DefaultItem = .InsertItem(h,Null,"Sub-Item B1")
		.CellState(0,1) = 1
		.InsertItem(h,Null,"Sub-Item B2")
		.DefaultItem = h
		.ExpandItem(0) = .T.
		.AddItem("Item C")
	endwith
	.FilterInclude = 1
	.FilterBarFont = .Font
	var_s = "`<fgcolor=0000FF><i>value/current</i></fgcolor>: <fgcolor=808080>` + value + `</fgcolor>` + `<br><fgcolor=0000FF><i>available</i"
	var_s = var_s + "></fgcolor>: ` + available + `<br><fgcolor=0000FF><i>allui</i></fgcolor>: ` + allui + `<br><fgcolor=0000FF><i>all</i></fgcolor>:"
	var_s = var_s + " ` + all + `<br><fgcolor=0000FF><i>itemcount</i></fgcolor>: <fgcolor=808080>` + itemcount + `</fgcolor>`+ `<br><fgcolor=0000FF><"
	var_s = var_s + "i>visibleitemcount</i></fgcolor>: <fgcolor=808080>` + visibleitemcount + `</fgcolor>`+ `<br><fgcolor=0000FF><i>matchitemcount</i"
	var_s = var_s + "></fgcolor>: <fgcolor=808080>` + matchitemcount + `</fgcolor>`+ `<br><fgcolor=0000FF><i>promptpattern</i></fgcolor>: <fgcolor=80"
	var_s = var_s + "8080>` + promptpattern + `</fgcolor>`+ `<br><fgcolor=0000FF><i>leafitemcount</i></fgcolor>: <fgcolor=808080>` + leafitemcount + "
	var_s = var_s + "`</fgcolor>`"
	.FilterBarCaption = var_s
	.FilterBarPromptPattern = "B"
	.FilterBarPromptVisible = 7 && FilterBarVisibleEnum.exFilterBarCaptionVisible Or FilterBarVisibleEnum.exFilterBarVisible Or FilterBarVisibleEnum.exFilterBarPromptVisible
	with .Columns.Item(0)
		.FilterType = 240
		.Filter = "Item A|Item B"
	endwith
	.ApplyFilter
	.EndUpdate
endwith
|
|
2004
|
I am using filter prompt feature, and also column's filter, just wondering if possible to compact displaying the filter bar so it won't show on multiple lines
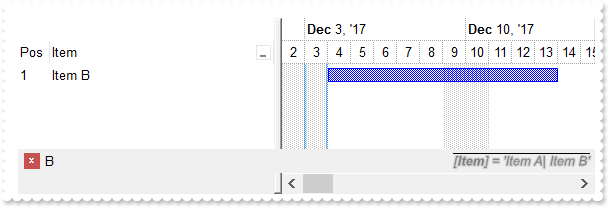
*** AddItem event - Occurs after a new Item has been inserted to Items collection. ***
LPARAMETERS Item
	with thisform.G2antt1
		.Items.AddBar(Item,"Task",{^2017-12-4},{^2017-12-14})
	endwith

with thisform.G2antt1
	.BeginUpdate
	with .Chart
		.LevelCount = 2
		.FirstVisibleDate = {^2017-12-2}
		.PaneWidth(0) = 256
	endwith
	.Columns.Add("Item").DisplayFilterButton = .T.
	with .Columns.Add("Pos")
		.AllowSizing = .F.
		.AllowSort = .F.
		.Width = 32
		.FormatColumn = "1 apos ``"
		.Position = 0
	endwith
	with .Items
		.AddItem("Item A")
		.AddItem("Item B")
		.AddItem("Item C")
	endwith
	.FilterBarFont = .Font
	.FilterBarCaption = "`<r><i><fgcolor=808080><upline><solidline><sha ;;0>` + value"
	.FilterBarPromptPattern = "B"
	.FilterBarPromptVisible = 2067 && FilterBarVisibleEnum.exFilterBarCompact Or FilterBarVisibleEnum.exFilterBarSingleLine Or FilterBarVisibleEnum.exFilterBarVisible Or FilterBarVisibleEnum.exFilterBarPromptVisible
	with .Columns.Item(0)
		.FilterType = 240
		.Filter = "Item A|Item B"
	endwith
	.ApplyFilter
	.EndUpdate
endwith
|
|
2003
|
Just wondering if it is possible to show the filter bar's close button on the right ( sample 2 )
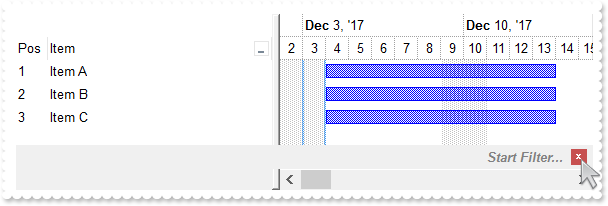
*** AddItem event - Occurs after a new Item has been inserted to Items collection. ***
LPARAMETERS Item
	with thisform.G2antt1
		.Items.AddBar(Item,"Task",{^2017-12-4},{^2017-12-14})
	endwith

with thisform.G2antt1
	.BeginUpdate
	with .Chart
		.LevelCount = 2
		.FirstVisibleDate = {^2017-12-2}
		.PaneWidth(0) = 256
	endwith
	.Columns.Add("Item").DisplayFilterButton = .T.
	with .Columns.Add("Pos")
		.AllowSizing = .F.
		.AllowSort = .F.
		.Width = 32
		.FormatColumn = "1 apos ``"
		.Position = 0
	endwith
	with .Items
		.AddItem("Item A")
		.AddItem("Item B")
		.AddItem("Item C")
	endwith
	.FilterBarPromptVisible = 1281 && FilterBarVisibleEnum.exFilterBarShowCloseOnRight Or FilterBarVisibleEnum.exFilterBarToggle Or FilterBarVisibleEnum.exFilterBarPromptVisible
	.FilterBarPrompt = .FormatABC("`<r>` + value",.FilterBarPrompt)
	.EndUpdate
endwith
|
|
2002
|
Just wondering if it is possible to show the filter bar's close button on the right ( sample 1 )
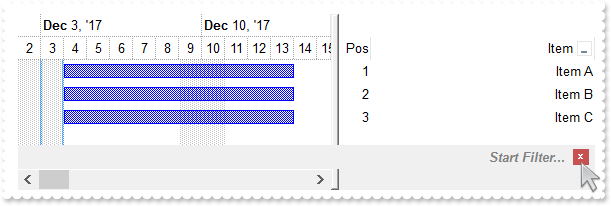
*** AddItem event - Occurs after a new Item has been inserted to Items collection. ***
LPARAMETERS Item
	with thisform.G2antt1
		.Items.AddBar(Item,"Task",{^2017-12-4},{^2017-12-14})
	endwith

with thisform.G2antt1
	.BeginUpdate
	with .Chart
		.LevelCount = 2
		.FirstVisibleDate = {^2017-12-2}
		.PaneWidth(0) = 256
	endwith
	.RightToLeft = .T.
	.Columns.Add("Item").DisplayFilterButton = .T.
	with .Columns.Add("Pos")
		.AllowSizing = .F.
		.AllowSort = .F.
		.Width = 32
		.FormatColumn = "1 apos ``"
		.Position = 0
	endwith
	with .Items
		.AddItem("Item A")
		.AddItem("Item B")
		.AddItem("Item C")
	endwith
	.FilterBarPromptVisible = 257 && FilterBarVisibleEnum.exFilterBarToggle Or FilterBarVisibleEnum.exFilterBarPromptVisible
	.EndUpdate
endwith
|
|
2001
|
How can I change the visual appearance of the filter bar's close button (EBN)
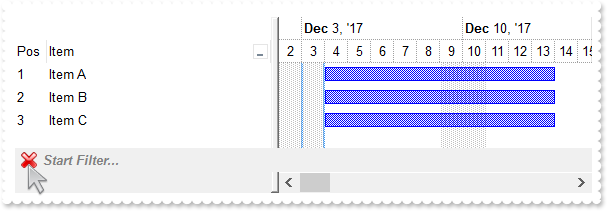
*** AddItem event - Occurs after a new Item has been inserted to Items collection. ***
LPARAMETERS Item
	with thisform.G2antt1
		.Items.AddBar(Item,"Task",{^2017-12-4},{^2017-12-14})
	endwith

with thisform.G2antt1
	.BeginUpdate
	with .Chart
		.LevelCount = 2
		.FirstVisibleDate = {^2017-12-2}
		.PaneWidth(0) = 256
	endwith
	with .VisualAppearance
		var_s = "gBFLBCJwBAEHhEJAAEhABHQDg6AADACAxRDgMQBQKAAzAJBIYhiG4cYCgMZhXDOCYXABCEYRXBIZQ7BKNIxjSJ5BhIAAyDSJMjSRJUEhqGCWYDleYYYAKHIMQLOg7IJj"
		var_s = var_s + "yI4/SJAYCydKAWhxIaZKJHCZoEDaTAADCNVAQp6MEIJVbVEI0e79OgBLp/Z7kECIJJAaRjHQdJxGLA8EhtCQhCZteK6SgMKJYXhWQYRXI1JwvMBrWrdQjiOYELQtMKmS"
		var_s = var_s + "ZNLYGG4dR5SVJbcYhSYsRRFMoyDIOXYDLKsdYqSpXIThObEGgaPqJYjsUjCMKnR7HVIURrBPC9TBPE69ZgmC6ucKPX51ShKFaBWDZcwFAS+UBuYCAILiEAQGZ1XT8ORO"
		var_s = var_s + "icbgJgSTJRlCaZeDsHY7QGR4xkSYp3CaExZAQMgalQYAwjCAAfBANxcA2TgKAUOpDCGFhKg0RpXCwCwDHQHQHEyAIkCkOhbFOGA8A8DohBgRg9AccZcn8EpEjMLI2C2D"
		var_s = var_s + "YxAgQgvAIUIVkoAAPBQDJlECTZ3CCYwDACQwUA8A5MCAWAWDiQi4l8aQOEgLJuBgBgDmYFAzEoIoIl0WALgKYJbBABADAAHgHg8VAMmqCQQDMXABAATYwTmNwBDATJXA"
		var_s = var_s + "iAgjHmNQ5lgQ5QEQEQMmcWg/GwD5ylyNw2gMcJcjsBgBgOQQDDhRpVAMMwnDBFw1B0Ax8D0DxOmmJJIGQTY5hGMAwkwM4CAYLZAmAOJnAqAojiIGg6iieYkmeAYOHaKJ"
		var_s = var_s + "DCyCwjH6AoggsQpQliAJLhgaJ0CESBTnyDwjk+cg4g4P5IHIHJ+BWRRzlYWAxiOUxihsY4KjKLJRGqC44FCegkkkM58iAKAPnIWIWD8SRSFSfQnkmewUhYP4GiGKJ7G0"
		var_s = var_s + "TIbCSUoggqUo0lAQ4LnEcBcD8Coiiif4nE+eAAn2HpOkcFJqi4T5SkyMw/kqQown8IBIBOdA+A+DJrBqVxXEqYo4lCApLhGHBnD8S4ymyfxmg+cwQkQP5egOUZIWoEAk"
		var_s = var_s + "jIeIPBMBJBD+TBjBifwvkuc58hQJQPmFrYykkchclSApKjGOBuD+TRDFCfw3mmIxNi8FxFlOXhVC4aYDFyPgvg2YBcBcLZGCGCJ0DSLRzGSWQ/lmY5+mEP5gmMDBZRSM"
		var_s = var_s + "RsFsOxMhMJJ/DsTpTnwaQaE+N5ojuNhdEYNI5C4TZJO1GRDmCaxnA2Yx4n8IpIjOTBQBQC5TgyYw7gUYRYikC0BYRwsDQBoB8eA6Q2hsE0BUXgywZtYCyHMKwnxSAhAQ"
		var_s = var_s + "HkIQhRrBaDsCwA4ERiB2EWAIYIXhhiVEgAEUYwwYjyASLge4FhHgRDkM8OQih0jWPkGgBBAQ"
		.Add(1,var_s)
	endwith
	.Columns.Add("Item").DisplayFilterButton = .T.
	with .Columns.Add("Pos")
		.AllowSizing = .F.
		.AllowSort = .F.
		.Width = 32
		.FormatColumn = "1 apos ``"
		.Position = 0
	endwith
	with .Items
		.AddItem("Item A")
		.AddItem("Item B")
		.AddItem("Item C")
	endwith
	.FilterBarPromptVisible = 257 && FilterBarVisibleEnum.exFilterBarToggle Or FilterBarVisibleEnum.exFilterBarPromptVisible
	.Object.Background(1) = 0x1000000
	.EndUpdate
endwith
|